Ranking TP53 VUS with ESM-2: Strong in the DNA-Binding Domain, Blind in the Disordered Regions
On this page
The question for a germline VUS queue
About 40% of variants returned by clinical sequencing are variants of uncertain significance (VUS) Variant of Uncertain Significance — a genetic variant found in a patient that hasn't been classified as definitively pathogenic or benign. Full definition (Federici & Soddu 2020) — and the classification bottleneck runs through every hereditary-cancer gene, TP53 included, with hundreds of variants awaiting interpretation. For TP53 — the Li-Fraumeni gene, and one of the most frequently mutated genes in human cancer (Bouaoun et al. 2016) — the practical question a genetic counselor or ClinGen panel member faces is narrow and concrete: of the dozens of uncharacterized missense variants in front of me, which should I send for functional testing first?
For germline TP53 missense variants in the DNA-binding domain — where the large majority of pathogenic Li-Fraumeni and hereditary-cancer TP53 variants sit (Guha & Malkin 2017) — ESM-2 A protein language model by Meta AI trained on 250 million protein sequences. Predicts how amino acid mutations affect protein function from sequence alone — no structure required. Full definition ranks how damaging each variant is likely to be well enough to prioritize that queue. Within that domain, its predictions show a positive Spearman rank-correlation A rank correlation coefficient (−1 to +1) that measures whether two variables agree in order, not magnitude. The primary metric for variant effect benchmarks. Full definition of 0.46 against the Giacomelli saturation functional screen (the DNA-binding-domain subset of it) and 0.68 against the DNA-binding-domain–focused Kotler assay (higher = the model’s ordering agrees with the experiment’s).
It is a ranking and triage tool — it tells you which variants to test first — not a binary damaging-versus-benign classifier, and not a substitute for functional assays or ACMG ACMG criteria allowing computational variant effect predictions to count as pathogenic (PP3) or benign (BP4) evidence in clinical variant classification, per Richards et al. 2015 guidelines. Full definition interpretation. And that reliability is specific to the structured DNA-binding domain. For TP53, the most useful question is not “how accurate is the model” but “which region of the protein is my variant in.”
NOTE
Deep mutational scanning (DMS) systematically measures the functional effect of every possible single amino acid substitution across a protein — the experimental gold standard for variant-effect data, but slow and expensive. ESM-2 (650M parameters, trained on ~250 million protein sequences) predicts variant effects from evolutionary patterns alone, with no experiment required. Spearman rho is a rank correlation: it asks whether two methods order variants from most- to least-damaging the same way, regardless of absolute scale.
What we measured
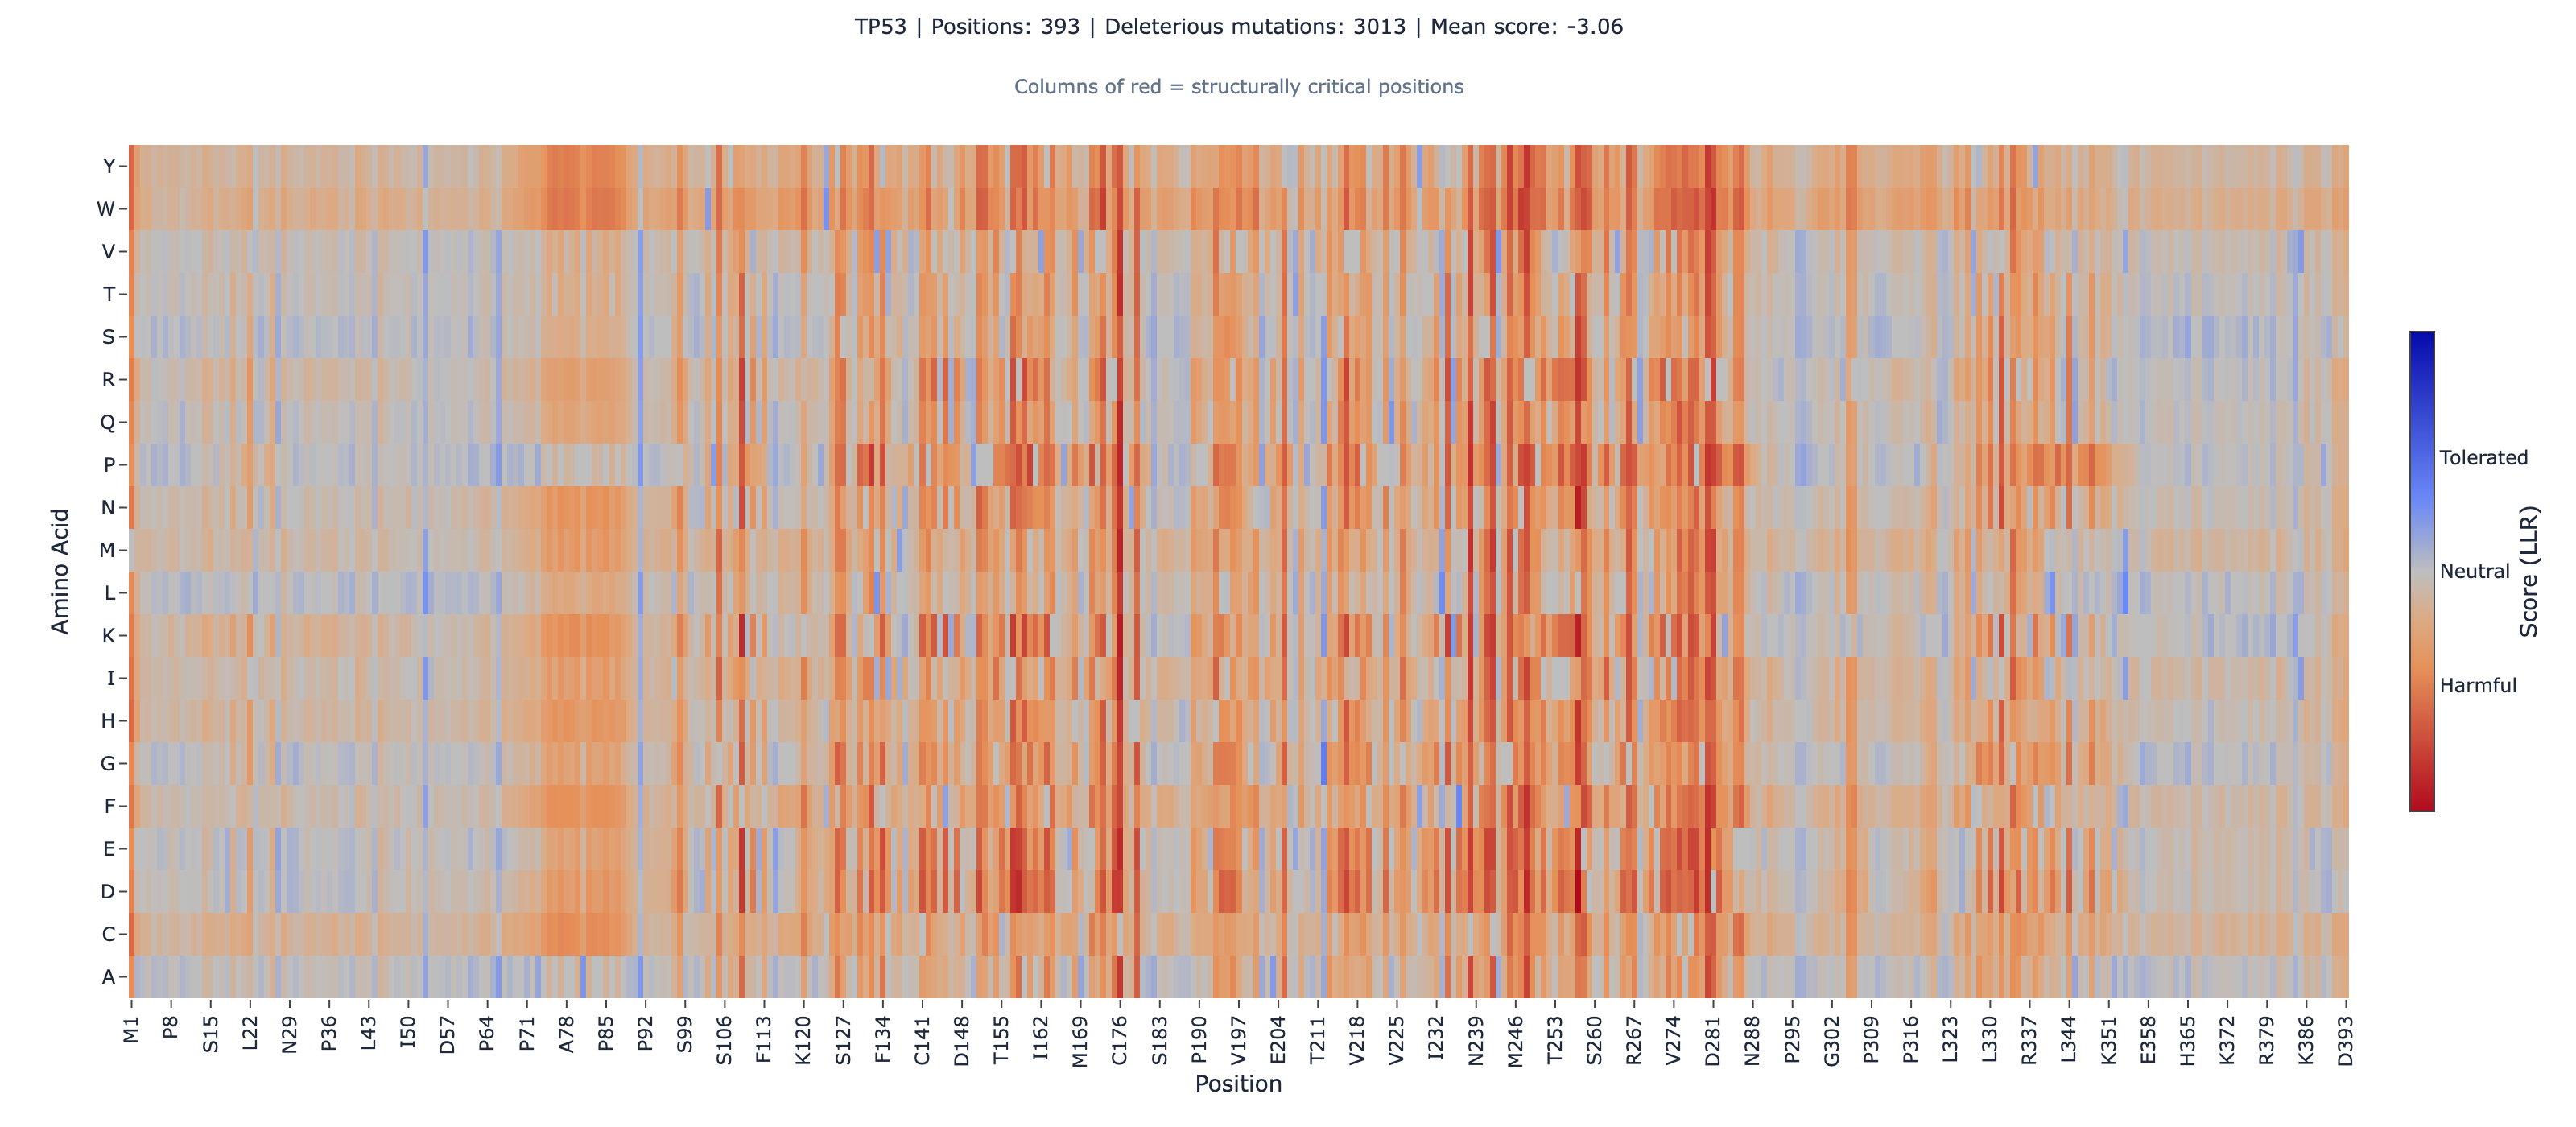
We scored the full-length TP53 protein (UniProt P04637, 393 amino acids, a single sequence) with ESM-2’s masked-marginal scoring method ESM-2's zero-shot method for scoring variant effects. It masks each position and measures how surprising the mutant amino acid is relative to wild-type. Full definition , then computed Spearman rank correlation against two published deep mutational scanning A lab technique that measures the functional effect of every possible single amino acid substitution across a protein. The gold standard for variant effect data. Full definition datasets:
- Giacomelli et al. 2018 (Nature Genetics 50(10):1381–1387) — functional scores for ~7,400 TP53 missense variants spanning the full protein, generated by MITE lentiviral saturation mutagenesis Creating every possible single amino acid substitution at every position in a protein — the prerequisite for deep mutational scanning. Full definition under three selection conditions (p53-null + nutlin-3, WT-p53 + nutlin-3, p53-null + etoposide).
- Kotler et al. 2018 (Molecular Cell 71(1):178–190) — a DNA-binding-domain–focused proliferation assay; we cross-reference the ProteinGym v1.3 benchmark subset of it (1,048 of the paper’s ~10,000 DBD missense variants).
This is internal validation — we ran ESM-2 against our own implementation, cross-referenced against these published experimental datasets. The DMS data is distributed through ProteinGym A standardized benchmark suite for protein variant effect predictors, covering 217 deep mutational scanning assays across diverse protein families. Full definition (Notin et al. 2023; 217 assays), where the published ESM-2 650M zero-shot baseline across the full suite is Spearman rho 0.414 CLM-2026-3415 Verified (rank 45 of 97 models on the live ProteinGym leaderboard CSV, accessed 2026-05-08). Every TP53 number below is read against that baseline.
NOTE
Sign convention. Throughout this report we use the ProteinGym convention: a more-negative ESM-2 score means more deleterious, and a more-negative DMS score means more loss-of-function. Because both run the same direction, a positive Spearman rho is the concordant result — the model and the experiment agree on the ordering. Strong concordant correlations are therefore positive; values near zero or negative (as in the disordered regions below) indicate the absence of a concordant signal, not a quantity to be sign-flipped.
The headline number is the wrong number
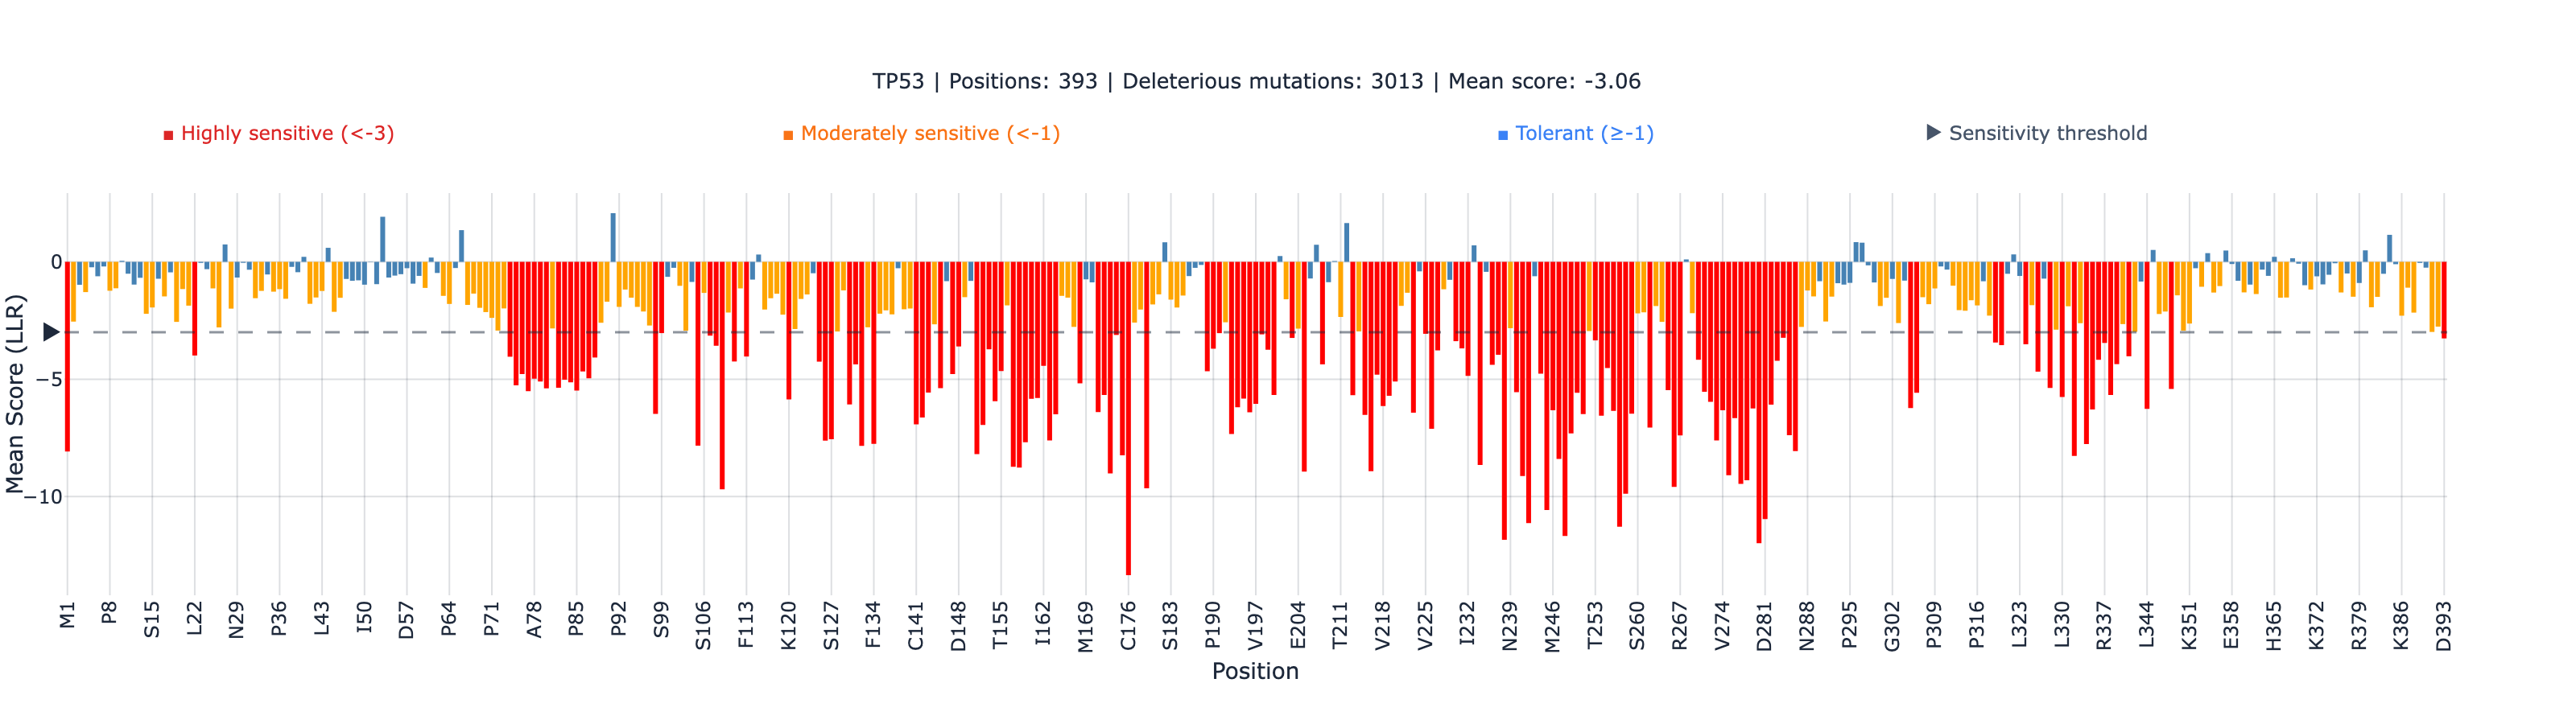
Measured across the entire 393-residue protein, ESM-2’s rank correlation with the Giacomelli functional scores is 0.41 CLM-2026-3403 Verified (N = 7,464 matched variants, p = 3.5 × 10⁻²⁹³). Taken alone, that is an unremarkable, middling result — and it is misleading, because it averages two completely different regimes together.
TP53 is roughly half structured and half intrinsically disordered. The folded DNA-binding domain does the sequence-specific DNA contact that defines p53’s tumor-suppressor function; the long disordered tails — the transactivation domains, the proline-rich linker, the C-terminal regulatory region — carry out their work through transient, context-dependent interactions that leave little evolutionary fingerprint for a sequence model to read. When we stratify by structural domain, the single global number splits into two:
| Region | Residues | rank-correlation (Giacomelli Null-Nutlin) | rank-correlation (Kotler) | N | Reliability |
|---|---|---|---|---|---|
| DNA-binding domain | 102–292 | 0.46 | 0.68 | 3,628 / 1,048 | Strong |
| Tetramerization | 323–356 | 0.38 (−0.41 vs WT-Nutlin) | — | 646 | Weak / assay-dependent |
| TAD1 (transactivation) | 1–40 | −0.02 | — | 760 | No signal |
| TAD2 (transactivation) | 41–61 | −0.26 | — | 399 | No signal |
| Proline-rich | 62–97 | −0.09 | — | 683 | No signal |
| C-terminal regulatory | 357–393 | −0.16 | — | 703 | No signal |

The DNA-binding domain reaches 0.46 CLM-2026-3404 Verified against Giacomelli and 0.68 CLM-2026-3405 Verified against the DBD-focused Kotler assay — well above the 0.414 published full-suite baseline. The intrinsically disordered regions sit between roughly 0 and −0.26 CLM-2026-3407 Verified — no usable functional signal in any of them. So within a single protein, the DNA-binding domain carries strong signal (0.46–0.68) and the disordered regions carry none (0 to −0.26) — opposite ends of usable. The global 0.41 isn’t wrong; it’s the average of a strong region and several blind ones, and it understates the model exactly where the clinically important variants live.
The practical consequence for a clinician: a single whole-protein accuracy figure is the wrong thing to ask for. The right question is whether your variant falls in the structured DNA-binding domain — and for germline TP53, the large majority of pathogenic variants do.
NOTE
This is also why a reproducibility-minded reviewer who recomputes “the TP53 number” and gets 0.41 is not contradicting us. 0.41 is the whole-protein figure; 0.46 / 0.68 are the DNA-binding-domain figures. The gap between them is the finding, not an error.
A worked example: R249S, the hepatocellular-carcinoma hotspot
R249S is one of the most studied TP53 variants — the signature mutation of aflatoxin-associated hepatocellular carcinoma, and a recurrent germline and somatic hotspot. It sits at position 249, inside the strong DNA-binding domain.
ESM-2 scores it −6.34 CLM-2026-3409 Verified (strongly deleterious), and all four DMS assays independently agree it is loss-of-function: Giacomelli Null-Nutlin −0.44 (33rd percentile), Null-Etoposide −0.32 (28th), WT-Nutlin −1.99 (4th percentile), and Kotler −0.37 (8th percentile). Model and four experiments, concordant, in the region where the model is reliable. This is the clean case: a DNA-binding-domain variant where ESM-2’s ranking and the functional data point the same way.
(A note on targeting: we group variants by cancer context — hepatocellular carcinoma here, Li-Fraumeni below — for the reader. ESM-2 sees only protein structure; it has no notion of cancer type. The biological variation that matters to the model is structural and per-domain, never the clinical label.)
The cancer hotspots: what the strong-negative scores do and do not mean
Across all 11 canonical TP53 cancer hotspots we tested, ESM-2 and the Giacomelli assay are concordant on the loss-of-function axis — every variant scores strongly deleterious by ESM-2, and loss-of-function (negative under the convention above) across all three Giacomelli selection conditions:
| Variant | ESM-2 (LLR) | Null-Nutlin | Null-Etoposide | WT-Nutlin |
|---|---|---|---|---|
| R248W | −12.47 | −0.61 | −0.69 | −1.55 |
| C176F | −12.24 | −0.45 | −0.35 | −1.73 |
| R248Q | −9.55 | −0.22 | −0.99 | −1.23 |
| C242S | −8.42 | −1.14 | −1.03 | −1.63 |
| R282W | −7.96 | −0.73 | −0.76 | −1.59 |
| G245S | −7.55 | −0.46 | −0.71 | −1.15 |
| R273C | −7.34 | −0.31 | −0.93 | −1.26 |
| R249S | −6.34 | −0.44 | −0.32 | −1.99 |
| R273H | −6.31 | −1.08 | −1.44 | −1.15 |
| R175H | −5.96 | −0.54 | −0.74 | −1.79 |
| Y220C | −3.78 | −0.63 | −1.15 | −1.53 |
Verified claims, by assay column: ESM-2 hotspot concordance, 11/11 CLM-2026-3408 Verified · Null-Nutlin CLM-2026-3412 Verified · Null-Etoposide CLM-2026-3413 Verified · WT-Nutlin CLM-2026-3414 Verified
The three Giacomelli columns are the assay’s three selection conditions (p53-null + nutlin-3, p53-null + etoposide, WT-p53 + nutlin-3); WT-Nutlin gives the deepest hotspot LOF signal of the three. Every cell is negative — concordant loss-of-function — in all four measurements.
This 11-of-11 concordance is real and DMS-validated — but it is strictly a loss-of-function result, and the distinction is load-bearing. ESM-2 scores R175H, R248W, and R273H strongly deleterious because it correctly detects that these mutations destroy p53’s wild-type DNA-binding fold. The Giacomelli nutlin assay measures exactly that loss. What neither ESM-2 nor this concordance addresses is the gain-of-function layer: R175H and R273H are canonical neomorphs that actively promote oncogenesis beyond the simple loss of p53 — they acquire new, harmful activities. ESM-2 cannot predict that.
In other words: ESM-2 ranks these hotspots correctly for the question it can answer (is the DNA-binding fold disrupted?), and is silent on the question it cannot (does the variant gain a new cancer-promoting function?). For a germline VUS-triage workflow, the first question is the relevant one. For somatic driver interpretation, ESM-2 is the wrong tool.
The honesty case: R337H, where the model and the assay are both blind together
R337H is a recurrent founder-effect germline TP53 variant in southern Brazil (Garritano et al. 2010) and a Li-Fraumeni allele — and it is the variant where it would be easiest to overclaim, so it is worth being precise.
ESM-2 scores R337H mild (−2.56) CLM-2026-3410 Verified , nowhere near the hotspot range. The tempting story would be “ESM-2 under-calls a known pathogenic variant.” That story is wrong, and the DMS is the arbiter. All three Giacomelli assays also score R337H functionally wild-type-like: +0.21 (58th percentile), +0.20 (42nd), and +0.96 (83rd) — positive scores meaning WT-like function under the convention above.
The reason is biological. R337H is a temperature-sensitive defect: the destabilization manifests at elevated temperature, not under the standard 37 °C conditions of the MITE functional assay. Under those conditions the protein behaves near-normally — so neither the sequence model nor the standard experiment flags it. The honest claim is not “ESM-2 missed R337H.” It is:
Sequence models and standard functional assays both miss conditional, temperature-sensitive defects. For a variant like R337H, you need the right assay — a temperature-shift functional test — not a different predictor.
This is the most important trust signal in this report, so we state it plainly: we are declining a win the data will not support. ESM-2 calling R337H mild is consistent with the experiment, not a failure of the model relative to it. The Li-Fraumeni clinical lesson is about assay design, not about which computational predictor to trust.
Where this fails
We document limitations openly, and proportionately to the results:
1. Outside the DNA-binding domain, there is no usable signal here. The intrinsically disordered regions score between 0 and −0.26. This is consistent with where ESM-2 is reliable: scoring degrades where the evolutionary signal a sequence model depends on is thin — as it often is in disordered regions, which tend to carry fewer conserved homologs (our multi-source applicability-domain benchmark). The disorder-specific reading — that scoring degrades specifically in intrinsically disordered regions — is, as of 2026-06-13, supported by a single preprint (Sharma & Gitter 2025, arXiv:2504.16886): one direct source, not an established boundary condition. The practical rule is unchanged either way: an ESM-2 score for a TP53 variant should only be interpreted if the variant lies in the structured DNA-binding domain (roughly residues 102–292); for disordered-region variants, experimental functional assays — saturation genome editing or full-length DMS — remain the evidence path.
2. The tetramerization domain is weak and assay-dependent. Residues 323–356 reach rho 0.38 against the Null-Nutlin and etoposide assays but flip to −0.41 against WT-Nutlin CLM-2026-3406 Verified . The oligomerization signal is not robustly captured; do not rely on ESM-2 ranking for tetramerization-domain variants.
3. Gain-of-function is invisible. As above (Boundary 7): ESM-2 detects fold loss, not oncogenic neomorphic activity. For suspected gain-of-function or somatic-driver questions, this is the wrong tool — those need structure-based and molecular-dynamics methods, not a sequence model.
4. Conditional defects are shared blind spots. R337H shows that temperature-sensitive (and, by extension, other context-conditional) defects are missed by sequence models and by standard functional assays alike.
5. Non-missense variants are out of scope. ESM-2 scores only single missense substitutions — not splice-site, frameshift, nonsense, or copy-number variants, which need dedicated tools (SpliceAI for splice effects, CNV callers for copy number).
6. It is a ranking tool, not a classifier. Fixed score thresholds do not generalize across proteins or domains; we do not publish a universal “damaging below X” cutoff. ESM-2 orders variants by predicted impact so you can prioritize testing — it does not assign a pathogenic/benign label.
What this means for variant classification
Used correctly, ESM-2 gives a genetic counselor or variant-classification lab a fast first-pass ranking of germline TP53 DNA-binding-domain VUS — a way to decide which of fifty uncharacterized variants merit functional testing first, while that testing is pending. It is the kind of evidence the ACMG framework treats as one supporting line (PP3/BP4), not a standalone determination: computational ranking, comparable in role to REVEL or CADD but derived from a protein language model A deep learning model trained on millions of protein sequences to predict how mutations affect function. NeuroAutomata uses ESM-2, a PLM developed by Meta AI. Full definition rather than ensembled features.
It does not classify variants, it does not see gain-of-function, and it carries no signal outside the structured domain. Within the DNA-binding domain — where the pathogenic germline variants concentrate — it is a useful triage instrument.
Research Use Only (RUO) Research Use Only — a regulatory designation meaning the tool provides research scores, not clinical diagnoses. The same label used by REVEL, CADD, AlphaMissense, and PolyPhen-2. Full definition . Same designation as REVEL, CADD, AlphaMissense, and PolyPhen-2. Clinical laboratories validate and incorporate computational scores under their own LDT workflows; ESM-2 ranking is provisional evidence while functional and clinical data are pending, never a final classification.
Reproduce this
Every quantitative result above is reproducible from public data:
- Get the experimental data. The Giacomelli and Kotler TP53 DMS datasets are distributed through ProteinGym (v1.3 substitution benchmark); the primary papers are Giacomelli et al. 2018 and Kotler et al. 2018.
- Score the protein. Paste the TP53 sequence (UniProt P04637, 393 aa) into the masked-marginal scoring tool and run a full-length landscape scan. Request early access to NeuroAutomata to run this yourself.
- Stratify, then correlate. Compute Spearman rank correlation between ESM-2 scores and DMS scores per structural domain — not just globally. The whole-protein number (≈0.41) will understate the DNA-binding-domain result (≈0.46 Giacomelli, ≈0.68 Kotler); that gap is the point.
| Resource | Link |
|---|---|
| Giacomelli et al. 2018 | Nat Genet 50(10):1381–1387 |
| Kotler et al. 2018 | Mol Cell 71(1):178–190 |
| DMS benchmark | ProteinGym (Notin et al. 2023) |
| UniProt | P04637 (P53_HUMAN) |
| ESM-2 model | facebook/esm2_t33_650M_UR50D |
TL;DR
- For germline TP53 missense VUS in the DNA-binding domain (residues 102–292), ESM-2 ranks functional impact reliably — Spearman rho 0.46 vs Giacomelli, 0.68 vs the DBD-focused Kotler assay, against a 0.414 published full-suite baseline.
- The whole-protein number (0.41) understates the tool: the DNA-binding domain is strong (0.46–0.68) while TP53’s disordered regions carry no signal (rho ≈ 0 to −0.26). Ask which region your variant is in, not for one accuracy figure.
- All 11 canonical cancer hotspots are concordant — but on the loss-of-function axis only. ESM-2 detects fold destruction; it is blind to gain-of-function (Boundary 7) and never predicts oncogenic driver activity.
- R337H is a shared model-and-assay blind spot: ESM-2 and the standard DMS both score it mild, because the temperature-sensitive defect doesn’t manifest at 37 °C. The lesson is assay design, not predictor choice.
- ESM-2 is a ranking/triage tool, RUO, for prioritizing which DNA-binding-domain VUS to functionally test first — a PP3/BP4-style supporting line, not a classifier and not a substitute for functional or clinical interpretation.
Claims inventory
Every quantitative statement in the prose and captions traces to a verified claim (CLM-2026-3401..3415) in the TP53 claims registry — the verification report shows the claim-by-claim breakdown and per-source provenance; the image-baked landscape aggregates in the figures are recompute-verified against the of-record substrate (recorded at the asset pin). This rendering was independently checked against the source claims by a verification pass separate from the authoring team.
| Claim ID | Statement in prose |
|---|---|
| CLM-2026-3401 | Giacomelli 2018: ~7,400 variants, MITE saturation mutagenesis, three selection conditions |
| CLM-2026-3402 | Kotler 2018: ProteinGym v1.3 subset, 1,048 of the paper’s ~10,000 DBD variants, proliferation assay |
| CLM-2026-3403 | Whole-protein vs Giacomelli: rho = 0.41, N = 7,464, p = 3.5 × 10⁻²⁹³ |
| CLM-2026-3404 | DNA-binding domain (102–292) vs Giacomelli: rho = 0.46, N = 3,628 |
| CLM-2026-3405 | DNA-binding domain via Kotler: rho = 0.68, N = 1,048 |
| CLM-2026-3406 | Tetramerization (323–356): rho = 0.38 (Null assays), −0.41 (WT-Nutlin) — weak/assay-dependent |
| CLM-2026-3407 | Disordered regions: rho ≈ 0 to −0.26 — no usable signal (vs strong DBD, 0.46–0.68) |
| CLM-2026-3408 | 11/11 cancer hotspots concordant on the loss-of-function axis (hotspot ESM-2 scores) |
| CLM-2026-3409 | R249S (HCC): ESM-2 −6.34; LOF in all four DMS assays |
| CLM-2026-3410 | R337H: ESM-2 mild (−2.56) and all three Giacomelli assays WT-like (+0.21/+0.20/+0.96) — shared blind spot |
| CLM-2026-3411 | ESM-2 is GOF-blind (Boundary 7); hotspot negatives are LOF detection, not GOF prediction |
| CLM-2026-3412 | Hotspot per-variant DMS — Giacomelli Null-Nutlin column (4-assay table): all 11 LOF |
| CLM-2026-3413 | Hotspot per-variant DMS — Giacomelli Null-Etoposide column: all 11 LOF |
| CLM-2026-3414 | Hotspot per-variant DMS — Giacomelli WT-Nutlin column: all 11 LOF (deepest signal) |
| CLM-2026-3415 | ESM-2 650M ProteinGym full-suite baseline: Spearman rho 0.414 (217 assays, rank 45/97) |
Analysis run on NeuroAutomata, a browser-based ESM-2 scoring platform, and directed by Jonathan Agoot — Axon Agentic. TP53 deep mutational scanning data from Giacomelli et al. 2018 and Kotler et al. 2018 via ProteinGym. ESM-2 model by Meta AI (Lin et al. 2023).