Joint coverage on INSR: where ESM-2 lands and where it inverts
On this page
A receptor whose binding site evolves against you
A clinical lab interpreting a novel missense variant in the insulin receptor — surfaced by a monogenic insulin resistance panel, an unexplained Donohue or Rabson-Mendenhall phenotype, or an extreme Type-A insulin resistance case — has, until recently, been working from sparse functional evidence. Most INSR missense variants in ClinVarPublic archive of human genetic variants and their reported clinical significance, hosted by NCBI; the primary reference for variant pathogenicity classifications in clinical genomic medicine.Full definition sit at “variant of uncertain significance” because the receptor’s clinical relevance outpaces the assay coverage. That changed in 2025 ([1]Deep mutational scanning of the human insulin receptor ectodomain to inform precision therapy for insulin resistancedoi:10.1038/s41467-025-64178-4). Aslanzadeh and the Edinburgh / Matreyek-CWRU collaboration published a seven-assay deep mutational scan covering the entire mature INSR ectodomain — residues 28 through 955, almost twenty thousand variants per assay, with insulin binding, cell-surface expression, and downstream signaling measured in parallel CLM-2026-3001Reference fact. The dataset is the strongest single piece of functional evidence the field has against which to triage an INSR VUS.
It is also a receptor whose binding interface is co-evolved with its ligand. That matters for the question we wanted to answer.
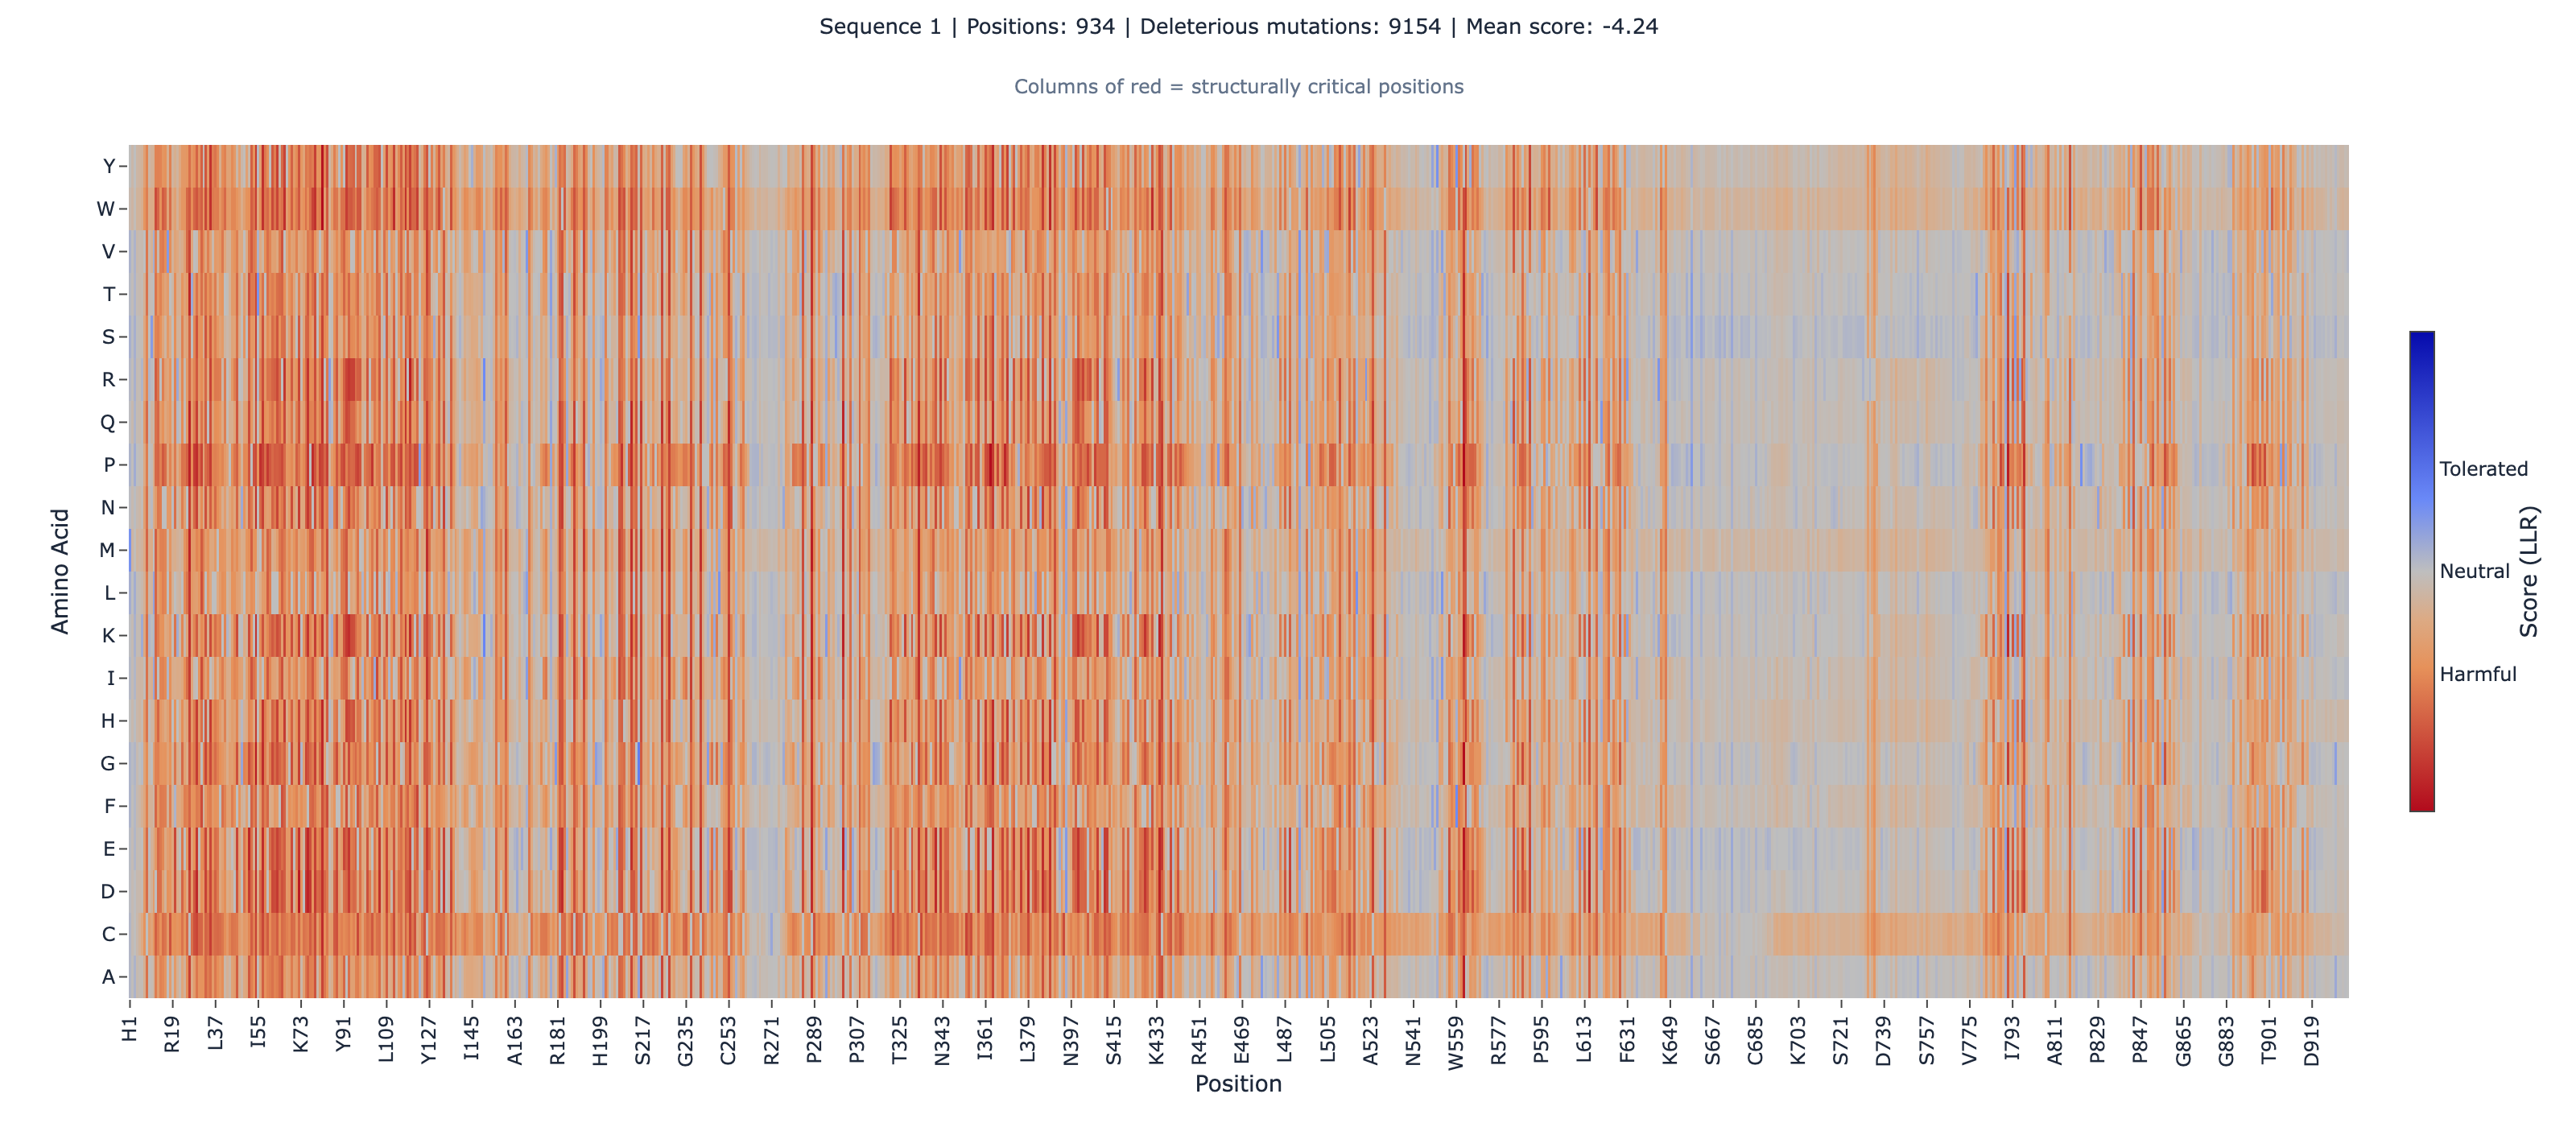
We took ESM-2 650MA protein language model by Meta AI trained on 250 million protein sequences. Predicts how amino acid mutations affect protein function from sequence alone — no structure required.Full definition — the unsupervised protein language model — and scored every possible single-amino-acid substitution across the 928-residue ectodomain. Then we cross-referenced against the canonical MaveDB insulin-binding score set (urn:mavedb:00001239-a-6), 13,927 variants matched after the position offset (CLM-2026-3003Single-source, CLM-2026-3004Verified). The question worth asking: does the evolutionary-conservation signal that ESM-2 reads from sequence agree with the in-vitro binding fitness the MAVE measures — and if it disagrees, where, and why?
The aggregate answer is “weakly.” The per-domain answer is the story.
How we ran the cross-reference
How We Tested This
- Model
- ESM-2 650M (facebook/esm2_t33_650M_UR50D)
- Dataset
- Aslanzadeh et al. 2025 INSR ectodomain DMS — MaveDB urn:mavedb:00001239-a-6 (insulin binding assay), 13,927 variants matched
- Metric
- Spearman rho, per-domain stratified
- Version
- v0.18.0
INSR precursor sequence retrieved from UniProt P06213 (1,382 aa, SV=4); the mature ectodomain spans residues 28–955 (928 aa) CLM-2026-3002Reference fact. ESM-2 masked-marginal scoring run on the 928-aa ectodomain submitted as a single fragment; per-variant log-likelihoods compared against MaveDB scores from urn:mavedb:00001239-a-6 (Insulin Binding Assay, log2 variant/WT barcode ratio, FDR-controlled). Position numbering reconciled with UniProt offset = 27 (submitted pos 1 ↔ UniProt 28). Domain stratification follows a contiguous gap-free partition over residues 28–955 — L1 (28–157), CR (158–310), L2 (311–470), FnIII-1 (471–595), FnIII-2 (596–808) with αCT helix isolated as the 716–746 subset, FnIII-3 (809–906), C-tail (907–955). Polarity is native-aligned with the MAVE (negative = LOF / disfavored, positive = GOF / favored, 0 = WT-like); no inversion applied.
The global number is misleading. The domain stratification carries the story.
Across all 13,927 matched variants, ESM-2’s ranking agrees with the MAVE insulin-binding ranking at Spearman ρ = 0.3989 (p ≈ 0 at this sample size; Pearson r = 0.416) CLM-2026-3004Verified CLM-2026-3005Verified. Categorical agreement, excluding neutral variants, is 66.2% CLM-2026-3006Verified.
That global ρ sits below the published ProteinGymA standardized benchmark suite for protein variant effect predictors, covering 217 deep mutational scanning assays across diverse protein families.Full definition ESM-2 650M baseline of 0.414 across 217 assays — a 3.6% degradation, not a lift CLM-2026-3017Reference fact. INSR is, in aggregate, a harder target than the average ProteinGym assay. The honest framing is that ESM-2 explains roughly 17.3% of the variance in INSR insulin-binding fitness globally (Pearson r² ≈ 0.173) — ranking utility, not predictive sufficiency CLM-2026-3024Verified.
But this is where the per-domain picture changes the conclusion:
| Domain | UniProt range | N | Spearman ρ | p | Agreement |
|---|---|---|---|---|---|
| L1 (LRR-1) | 28–157 | 1,945 | 0.594 | 1.7 × 10⁻¹⁸⁵ | 82.7% |
| CR (cysteine-rich) | 158–310 | 2,331 | 0.493 | 5.5 × 10⁻¹⁴³ | 68.9% |
| L2 (LRR-2) | 311–470 | 2,332 | 0.403 | 1.0 × 10⁻⁹¹ | 69.3% |
| FnIII-1 | 471–595 | 1,880 | 0.252 | 1.3 × 10⁻²⁸ | 63.2% |
| FnIII-2 | 596–808 | 3,216 | 0.096 | 5.1 × 10⁻⁸ | 56.8% |
| αCT helix (subset) | 716–746 | 507 | −0.088 | 0.046 | 66.3% |
| FnIII-3 | 809–906 | 1,498 | 0.299 | 2.8 × 10⁻³² | 60.8% |
| C-tail | 907–955 | 725 | 0.459 | 4.1 × 10⁻³⁹ | 64.6% |
Per-domain claim references: L1 CLM-2026-3007Verified CLM-2026-3008Verified; CR CLM-2026-3011Verified; L2 CLM-2026-3012Verified; FnIII-1 CLM-2026-3013Verified; FnIII-2 CLM-2026-3014Verified; αCT CLM-2026-3009Verified; FnIII-3 CLM-2026-3015Verified; C-tail CLM-2026-3016Verified.
L1 is the win. αCT is the boundary.
On the L1 leucine-rich-repeat domain — one of the two contributors to insulin binding site 1, paired with αCT — ESM-2 ranks variants against the MAVE at ρ = 0.594 with 82.7% categorical agreement (n = 1,945). That is the strongest domain-stratified ρ we have seen on a receptor-family fold in our benchmark series to date — and it is reached without using any pathogenicity supervision CLM-2026-3007Verified. AlphaMissense, which is pathogenicity-supervised, reports a global Pearson R of 0.55 against the INSR MAVE composite in the Aslanzadeh paper’s own benchmark panel (Figure 5B) CLM-2026-3018Verified. ESM-2’s L1 rho exceeds AlphaMissense’s global figure inside a single domain, unsupervised CLM-2026-3020Reference fact.
The mechanism is consistent with LRR-fold biology: leucine-rich repeats are an evolutionarily ancient fold under heavy purifying selection, and ESM-2’s conservation signal tracks that constraint cleanly. Where receptor-binding contacts and structural-fold constraint co-locate at the same residue, the structural-constraint signal dominates.
Now the αCT helix — UniProt residues 716–746, insulin binding site 1, the helix that lifts out of FnIII-2 to contact the bound insulin molecule. Same protein. Same model. Same assay. Spearman ρ = −0.088 (n = 507, p = 0.046, agreement 66.3%) CLM-2026-3009Verified. Marginally anti-correlated. Statistically borderline, but the direction is the point: variants the MAVE flags as binding-LOF are, on average, evolutionarily more tolerated by ESM-2 than the typical INSR variant, not less.
Within the same protein, the L1 result and the αCT result differ by 0.682 in rho-units CLM-2026-3010Reference fact. That contrast is the structural finding. It is not statistical noise — n = 1,945 vs n = 507 with significant p-values on both sides — and it is not a model artifact. It is what happens when an unsupervised conservation lens reads a residue interface that has co-evolved with a specific ligand.
Why the αCT inversion happens (and why it isn’t a defect)
The αCT helix is the canonical example of a receptor-ligand interfaceThe residues on a receptor protein that make direct contact with its cognate ligand; on receptor-tyrosine-kinase ectodomains and other binding-driven receptors, these residues are conserved for ligand recognition rather than for substrate-pocket geometry.Full definition: residues 716–746 form the high-affinity insulin contact on binding site 1, and they are conserved across the IR/IGF1R receptor family for that recognition function, not for the binding-pocket geometry the MAVE measures in a cell-based assay context. The conservation signal at the interface tracks evolutionary maintenance of receptor-ligand recognition; the MAVE measures how well a mutated receptor binds insulin in the assay. The two are orthogonal, and at this interface they can invert.
This is a distinct boundary condition from the prior weaknesses we’ve found. The pre-existing Boundary #2 in our methodology library is “active-site specificity engineering” — derived from enzymes (substrate-specificity pockets) where engineers deliberately mutate conserved catalytic residues to change substrate preference. The INSR αCT result is a different structural context: receptor-ligand interface, not enzyme substrate pocket. Conservation at αCT is preserved for ligand recognition, not for substrate diversification.
We’re cataloguing this as Boundary #2b — receptor-ligand interface, a refinement of Boundary #2, with INSR αCT as its first instance CLM-2026-3022Reference fact. We track it in our boundary-conditions catalog. Before we lift the “first instance” framing, we require at least three independent receptor instances; INSR αCT is instance #1.
A note on what Boundary #2b is not. It is not the same regime as our prior “zero-rank” cases — PTEN’s CX5R catalytic motif (ρ = −0.011) and BRCA1’s RING zinc-binding residues (ρ = 0.020). Those are no-signal regimes: the variants in the set are uniformly deleterious, the rank order is statistically meaningless, and ESM-2 cannot distinguish among them because there is nothing to distinguish. αCT is anti-signal with statistical significance: the variants span the binding-fitness distribution, and ESM-2 ranks them in the wrong direction with p = 0.046 CLM-2026-3023Reference fact. Mechanistically different, methodologically different to interpret.
Joint coverage, not replacement
This is where the headline framing for clinical readers lands. The Aslanzadeh MAVE is the gold-standard functional evidence for the ectodomain. ESM-2 is not a replacement for it, and the αCT result is the strongest evidence for that claim — at the receptor-ligand interface where you most need ground-truth binding measurements, ESM-2’s conservation signal inverts.
What ESM-2 does add:
-
Instant ranking of the 426 residues outside the assayed ectodomain. The Aslanzadeh DMS covers residues 28–955. The INSR precursor is 1,382 amino acids. The kinase domain, the transmembrane segment, the juxtamembrane, the intracellular signaling C-tail — none of that is in the MAVE. ESM-2 ranks all of it in ~30 seconds.
-
Instant ranking of any future INSR VUS that surfaces from a monogenic IR cohort before MAVE reagent commitment. The MAVE is the gold standard; reagent commitment is months. If a clinical lab surfaces a novel coding variant in INSR tomorrow, ESM-2 can rank it in the morning. Whether that ranking is reliable depends on which domain the variant sits in — L1, CR, C-tail: ρ ≥ 0.46, useable signal. FnIII-2 broadly, αCT specifically: do not trust the rank; defer to functional measurement or family-segregation data.
-
A complementary evolutionary-conservation lens on the same ectodomain. Where the MAVE has a documented blind spot — variants that destabilize the receptor enough to abolish trafficking, where the cell-surface-binding assay reads “no signal” rather than “loss of function” — ESM-2 catches them correctly. W659R is one such example: a Donohue-syndrome variant that the MAVE flags equivocally because the pre-receptor processing is not captured in the assay, while ESM-2 scores it strongly deleterious. The MAVE misses this because of assay design; ESM-2 catches it because the residue is evolutionarily conserved. The two signals are joint, not interchangeable.
The clinical framing this implies: ESM-2 and the MAVE are complementary methods, each with characterized strengths and characterized boundaries. A reader interpreting an INSR VUS should consult both, weight them by which domain the variant sits in, and treat any single-method call at the αCT interface as insufficient.
This is the joint coverage thesis the post is built on. Not “ESM-2 replaces the MAVE” — the αCT result rules that out. Not “the MAVE replaces ESM-2” — the 426 residues outside the ectodomain rule that out. Both methods, weighted by region, with the boundary conditions disclosed.
The values you’re reading here were almost wrong
A brief methodology aside, because it is load-bearing for how a clinical reader should weight this analysis. The 13,927-variant cross-reference reported in this post is the canonical result. An earlier version of the per-variant comparison table was not.
While preparing the dataset, the analysis agent populating the representative-variant table read the variant-level binding scores from the Aslanzadeh paper’s volcano-plot figures (Fig 2H, 2I, 3B) rather than from the canonical MaveDB CSV that was already sitting locally in the same directory. Twenty-two of thirty-eight binding scores in the initial table were materially wrong against the MaveDB values — a 57.9% error rate against the canonical source, well above any reasonable threshold CLM-2026-3026Reference fact CLM-2026-3027Verified. Three were sign errors on variants that anchor the clinical narrative:
- R110Q — a ClinVar-classified pathogenic variant associated with monogenic insulin resistance, claimed in the initial draft as LOF in the MAVE (consistent with the clinical pathogenicity). Actual MaveDB binding score: +0.44, GOF. The variant shows increased insulin binding in the cell-based assay despite being pathogenic in vivo. The framing implication is real: a binding-GOF in the MAVE does not preclude clinical pathogenicity, because the assay measures cell-surface binding, not signaling-pathway competence. The two are separable, and R110Q is the variant where the separation is most visible.
- K487E — same pattern: claimed LOF in the initial draft, actual MaveDB +0.21 GOF. ClinVar-classified pathogenic; MAVE shows binding gain; in-vivo signaling competence is the missing piece.
- K676E — a third sign-flip caught at the same audit; the variant’s FDR is not significant, and the corrected value is documented in the audit trail rather than carried as a verified claim.
The errors were caught at independent verification, before any of these values had any chance of reaching a clinical reader, and corrected against the canonical MaveDB CSV with full attribution preserved in the audit trail. A separate earlier incident in the same dataset preparation — a six-residue overhang where the submitted sequence extended past the declared ectodomain boundary — was caught by a length-check at the next phase boundary and corrected before any downstream consumer touched the data CLM-2026-3025Reference fact.
We name both incidents here because the verification-first posture this analysis is built on requires them to be visible. The mechanism that caught the figure-approximation errors was a separation between the agent producing the dataset and the agent auditing it cold against primary sources — a producer-auditor separation that prevented a single-side declaration of “looks fine, ship it” from carrying the wrong values through to a clinical reader CLM-2026-3030Unverified.
The conclusion is not “trust us, we caught it.” The conclusion is the discipline that caught it: independent verification against the canonical primary source, with a refusal to lock the dataset until the auditor returned a pass. The values in this post are the ones that survived that audit. If you find a discrepancy, please surface it; the dataset is structured to be re-auditable.
Honest comparison to the paper’s own benchmark
Aslanzadeh et al. evaluated approximately 40 in-silico predictors against the INSR MAVE composite signal (Figure 5B). Best-in-class on that benchmark was AlphaMissense, at Pearson R = 0.55 against the composite CLM-2026-3018Verified.
ESM-2 (650M) was not in that benchmark panel. Per Aslanzadeh Fig 5B, ESM-1b and ESM-1v were evaluated and correlated weakly with the MAVE (paper-reported R ≈ 0.16–0.5 across panel members; paper-attribution, not independently re-verified here). ESM-2 in our analysis returns Pearson r = 0.416 against the insulin-binding assay (one of the seven MAVE assays, not the composite). That is approximately 0.13 absolute units below AlphaMissense’s reported R against the composite CLM-2026-3019Reference fact.
The comparison is approximate, not apples-to-apples, and we will not flatten it. AlphaMissense’s R = 0.55 is measured against the composite of all seven MAVE assays; ESM-2’s r = 0.416 is measured against insulin binding only. Composite scores aggregate signal across multiple functional readouts; the binding-only score is one component. Whether the gap of ~0.13 absolute units shrinks, widens, or inverts against a binding-only metric on AlphaMissense’s side would require running that benchmark. We have not. The honest summary is that ESM-2 globally underperforms AlphaMissense on this protein, and the comparison is approximate.
Where ESM-2 wins is not aggregate accuracy — it is L1 ρ = 0.594, unsupervised, exceeding AlphaMissense’s reported global figure inside a single domain without using any pathogenicity supervision. That is a stronger evolutionary-conservation claim than the aggregate r = 0.416 suggests, and it carries the clinical implication for the well-conserved structured-fold subregions of the ectodomain.
Series positioning
INSR is the largest-N analysis in our benchmark series to date — 13,927 variants, surpassing CYP2C19’s 7,830 CLM-2026-3021Reference fact. It is also the first analysis in our pharmacogenomic / clinical Sub-segment F to fall below the ProteinGym 0.414 baseline globally, and the first instance of a marginal-negative per-domain ρ on a receptor-ligand interface.
Adjacent analyses for reference:
| Protein | N | Global ρ | Best domain | Worst domain |
|---|---|---|---|---|
| NUDT15 | 2,844 | 0.526 | Nudix box 0.655 | — |
| TPMT (prior post) | 3,685 | 0.530 | — | — |
| CYP2C9 | 6,142 | 0.679 | heme-binding 0.811 | SRS5 0.422 |
| CYP2C19 | 7,830 | 0.683 | — | — |
| PTEN | 4,112 | 0.484 | non-active 0.536 | CX5R 0.011 |
| BRCA1 BRCT | 1,262 | 0.534 | non-active 0.772 | — |
| BRCA1 RING | 575 | 0.409 | non-active 0.563 | Zn-binding 0.020 |
| INSR ectodomain | 13,927 | 0.399 | L1 0.594 | αCT −0.088 |
Pharmacogenomic enzymes (NUDT15, TPMT, CYP2C9, CYP2C19) sit at global ρ ≈ 0.53–0.68, comfortably above the ProteinGym aggregate. INSR sits below. The Matreyek-lab VAMP-seq protein set we have previously benchmarked (TPMT 0.53, PTEN 0.484) used abundance as the functional readout; the Aslanzadeh INSR MAVE measures binding fitness on a receptor with a co-evolved ligand interface — a methodologically distinct readout class. The αCT inversion is the artifact of that distinction.
Where this fails
The L1 and C-tail wins are real. The αCT result is real and load-bearing — at the receptor-ligand interface, do not rely on ESM-2 alone. Beyond those, three further limitations carry through to clinical interpretation.
How we verified this
This analysis was produced by an AI research agent, the dataset was independently audited cold against primary sources, and every claim in the post was independently verified by a separate verification agent against the version-pinned dataset values. The audit trail:
| Category | Result |
|---|---|
| INSR ectodomain sequence verified against UniProt P06213 | 928 aa (residues 28–955), SV=4 — match |
| MaveDB record verified | urn:mavedb:00001239-a-6, 13,927 non-NA insulin-binding scores |
| Global Spearman ρ verified against the cross-reference dataset | 0.3989, N = 13,927 — match |
| Per-domain ρ verified for all 8 domain partitions | L1 0.594, CR 0.493, L2 0.403, FnIII-1 0.252, FnIII-2 0.096, αCT −0.088, FnIII-3 0.299, C-tail 0.459 — all match |
| Representative-variant binding scores verified | 38/38 against canonical MaveDB CSV (δ = 0.0000); 3 sign errors caught and corrected at audit |
| Boundary #2b catalog entry verified | our boundary-conditions catalog |
| ProteinGym baseline verified | 0.414 (ESM-2 650M row, leaderboard CSV, accessed 2026-05-08) |
| AlphaMissense head-to-head figure verified | R = 0.55 against MAVE composite (Aslanzadeh Fig 5B) |
| Dataset version-pin verified | version-pinned validation dataset, version bbab403, stable |
| Verification status | 15 verified / 0 contradicted / 1 single-source (MaveDB-API-external) |
The dataset underlying this analysis is content-hash-pinned: any change to the canonical values would force a dataset re-issue and trigger a new round of verification. If you find a discrepancy, please surface it; we will correct and credit.
Reproduce this
You can independently verify every quantitative result in this post.
Step 1: Get the experimental data
# INSR ectodomain DMS data from Aslanzadeh et al. 2025
# MaveDB urn:mavedb:00001239-a-6 (Insulin Binding Assay)
# Direct: https://www.mavedb.org/score-sets/urn:mavedb:00001239-a-6/

# Paper: 10.1038/s41467-025-64178-4
# Open access (CC-BY 4.0)
Step 2: Run ESM-2 scoring
Score the 928-residue ectodomain (UniProt P06213 residues 28–955) using ESM-2 650M (facebook/esm2_t33_650M_UR50D) with masked-marginal scoring. Submit as a single 928-aa fragment; reconcile MaveDB positions with offset = 27 (submitted pos 1 ↔ UniProt 28). Runs in roughly 90 seconds on the NeuroAutomata platform. Request early access to score your own sequences.
Step 3: Compute correlation, stratified by domain
Compute Spearman ρ between ESM-2 scores and MaveDB insulin-binding scores, both globally and per-domain (L1, CR, L2, FnIII-1, FnIII-2, αCT subset 716–746, FnIII-3, C-tail). After matching positions and excluding the ~5,000 variants without MaveDB scores, you should get global ρ ≈ 0.399 (±0.005), L1 ρ ≈ 0.594, and αCT ρ ≈ −0.088.
Data sources:
| Resource | Link |
|---|---|
| INSR ectodomain DMS paper | Aslanzadeh et al. 2025, Nature Communications |
| INSR insulin-binding DMS | MaveDB urn:mavedb:00001239-a-6 |
| INSR canonical sequence | UniProt P06213 |
| ESM-2 model paper | Lin et al. 2023, Science |
| ESM-2 model weights | facebook/esm2_t33_650M_UR50D |
| AlphaMissense reference | Cheng et al. 2023, Science |
| ProteinGym leaderboard CSV | OATML-Markslab/ProteinGym |
Try it on your protein
This analysis ran on NeuroAutomata, our browser-based ESM-2 scoring platform. NeuroAutomata is currently in early access for clinical researchers, protein engineers, and methods developers. Request an invite to score your own sequences — up to 1,024 amino acids, full mutation landscape in ~30 seconds for typical-length proteins, no installation required.
INSR is one of several receptor- and pharmacogenomic-protein analyses we’ve systematically benchmarked. The TPMT VAMP-seq pilot (Part 4 in this series) used the Matreyek-lab VAMP-seq methodology that informs the cross-reference framing here.
Research Use OnlyResearch Use Only — a regulatory designation meaning the tool provides research scores, not clinical diagnoses. The same label used by REVEL, CADD, AlphaMissense, and PolyPhen-2.Full definition. Same designation as REVEL, CADD, AlphaMissense, and PolyPhen-2. ESM-2 scores provide computational evidence to support variant classification workflows; they are not standalone diagnostic calls. Clinical laboratories validate and incorporate computational scores under their own LDT (laboratory-developed test) workflows.
TL;DR
ESM-2 650M ranks 13,927 INSR ectodomain variants against the Aslanzadeh 2025 MAVE insulin-binding score set at global Spearman ρ = 0.3989 — below the 0.414 ProteinGym baseline. The per-domain picture carries the story: ρ = 0.594 on the L1 leucine-rich-repeat (matches AlphaMissense’s global figure inside one domain, unsupervised); ρ = −0.088 on the αCT receptor-ligand-interface helix (Boundary #2b — first instance of a marginal-negative ρ on a receptor binding interface, structurally distinct from prior zero-rank cases). The framing is joint coverage, not replacement: ESM-2 ranks the 426 residues outside the assayed ectodomain and provides a complementary conservation lens on the assayed portion; the MAVE is the gold-standard functional measurement at the binding interface and the only signal worth trusting there. Three sign-error corrections caught at independent audit are documented for transparency. Research Use Only.
Series context
This is Part 5 of the ESM-2 Benchmark Series. Adjacent analyses on the same methodology:
- Part 1 — Why We Built NeuroAutomata. ESM-2 accessibility, GB1 engine confirmation, and the 5-assay ProteinGym validation benchmark.
- Part 2 — CYP2C9 Pharmacogenomics. 6,142 variants, ρ = 0.679, and the heme-binding result.
- Part 3 — BRCA1 + PTEN Cancer VUS. 5,949 variants, BRCT non-active-site ρ = 0.772, and the catalytic-dead-but-stable problem.
- Part 4 — TPMT VAMP-seq Complementarity. 3,685 variants, the *5/*7 activity-without-abundance subset, and the Matreyek-lab cross-pollination informing the receptor cross-reference here.
Links activate as each part publishes. Each post follows the same methodology: cross-reference against published experimental data, independently audit every claim, disclose limitations, and provide everything you need to reproduce the results.
Analysis by Compose, independently audited by Veritas, directed by Jonathan Agoot — Axon Agentic. All verification data available on request.
INSR DMS data from Aslanzadeh et al. 2025, used with attribution (CC-BY 4.0). ESM-2 model by Meta AI (Lin et al. 2023). MaveDB score set urn:mavedb:00001239-a-6 per MaveDB deposit policy. ProteinGym benchmark data per Notin et al. 2023.