How we validate NeuroAutomata's predictions — and how an independent AI agent verifies that we did
On this page
The trust problem this page is inside
AI is generating scientific content faster than scientific publishing’s trust architecture can verify it — and most AI-tool validation pages are written by the same systems whose outputs they validate. This page is what a validation report looks like when an independent AI verification agent checks every claim before publication. Every green badge below is a clickable audit trail back to the primary source it was checked against, the exact source version, and the result.

Before generative AI, scientific publishing built trust slowly and imperfectly. Peer review, DOI assignment, and a long-tail correction loop meant errors took months or years to surface — but when they did, the chain back to the original claim was traceable. Retractions propagated into the citation graph; faulty results got flagged, re-investigated, and formally withdrawn, with a paper trail downstream readers could follow. The trust architecture was institutional rather than technological: imperfect, slow, and accountable.
The current state is different in kind. AI-related retractions surged sharply in 2023 and remained elevated into 2024 ([1]Frontiers in Research Metrics and Analytics 2025 bibliometric review of AI-related retractionsdoi:10.3389/frma.2025.1737168). Retracted content continues to accumulate citations long after retraction — in many cases at above-average rates relative to the field ([2]Frontiers in Research Metrics and Analytics 2025 bibliometric review of AI-related retractionsdoi:10.3389/frma.2025.1737168). The median time from publication to retraction stretches into the second year ([3]Frontiers in Research Metrics and Analytics 2025 bibliometric review of AI-related retractionsdoi:10.3389/frma.2025.1737168), meaning flawed results circulate for the period it would take a junior researcher to build half a thesis on top of them. And when ChatGPT 4o-mini was tested against thousands of retraction-recognition trials, the result was systematic failure: zero correct identifications ([4]Wiley Learned Publishing 2025 — 'ChatGPT tends to ignore retractions' (empirical evaluation)doi:10.1002/leap.2018). The trust architecture that took the pre-gen-AI publishing world a century to build does not survive contact with content generated at a rate the citation graph cannot absorb.
AI-tool validation pages are inside this problem. AI-generated content with fabricated or hallucinated citations has been documented in published scientific literature ([5]Zhang et al. 2024 *Surfaces and Interfaces* retraction (Crossref RETRACTED: prefix) + Harvard Misinformation Review GPT-fabricated-papers audit (2024). Retraction Watch case studies cited as adjacent-context only.doi:10.1016/j.surfin.2024.104081), and independent verification layers on inference-tool validation surfaces remain uncommon in the documented record (CLM-METHOD-TRUST-005bVerified). For a reader looking at a vendor benchmark page today, the distinction between “this number was checked against a primary source” and “this number was asserted by the same system that is promoting it” is the entire question.
Our own process has caught the failure mode in flight. A claim drafted by one of our agents — that a specific percentage of postdoctoral researchers reported using AI tools in their workflow, attributed to a 2025 Nature commentary — initially passed our verification layer. Re-checking against the open primary source the commentary was reporting on caught the drift: the percentage cited was from a different population, measuring a different question, and the original framing did not survive contact with the underlying survey data. We surface this case openly because the process catching its own near-miss is the trust mechanism. The process is not infallible. It is auditable, and it improves under iteration (CLM-METHOD-TRUST-006Verified).
This page is what a validation report looks like when those mechanisms are running. The numbers below trace to typed claims with primary-source receipts. The verification results are recorded before the page goes live, version-controlled in a public audit trail. The green badges throughout the page are clickable — each one expands to show the claim text, the primary source, the exact source version the verifier checked against, and the verification result. Before we get to the numbers, the next two sections establish what NeuroAutomata predicts, what we measured those predictions against, and how the verification mechanism works — so the figures in §4-§6 land at full resolution.
What NeuroAutomata predicts and what we measured against
Already familiar with protein language models, deep mutational scanning, and ProteinGym? Skip to §3.
NeuroAutomata is an inference platform that scores protein variants for likely functional disruption. The model behind it is ESM-2A protein language model by Meta AI trained on 250 million protein sequences. Predicts how amino acid mutations affect protein function from sequence alone — no structure required.Full definition 650M, a protein language modelA deep learning model trained on millions of protein sequences to predict how mutations affect function. NeuroAutomata uses ESM-2, a PLM developed by Meta AI.Full definition in the same architectural family as the language models that power text generation, but trained on amino acid sequences instead of English text. ESM-2 learned, across roughly 65 million protein sequences, which amino acid changes evolution tolerates and which it does not. Given a single amino acid change — say, R245C in BRCA1 — ESM-2 produces a per-variant fitness score that ranks variants from most-likely-disruptive to most-likely-tolerated. The analogy to text generation is useful at the architectural level and breaks at the semantic level: protein “words” do not carry meaning at the single-token level the way English words do, so an ESM-2 score for one amino acid in isolation is not interpretable without the surrounding sequence context.

The wet-lab gold standard against which we measure ESM-2 is deep mutational scanningA lab technique that measures the functional effect of every possible single amino acid substitution across a protein. The gold standard for variant effect data.Full definition (DMS): a saturation-mutagenesis experiment that mutates every position in a protein to every alternative amino acid, then measures the functional consequence empirically. The result is a dataset of thousands of variants with quantitative fitness scores grounded in laboratory observation rather than model prediction. For readers familiar with saturation mutagenesis at smaller scale, DMS is the same experimental logic at protein-wide scale with a quantitative readout.
The comparison metric between predicted and measured fitness is Spearman rank correlationA rank correlation coefficient (−1 to +1) that measures whether two variables agree in order, not magnitude. The primary metric for variant effect benchmarks.Full definition (ρ), a value between −1 and +1 measuring whether the model’s ranking of variants matches the wet-lab ranking. A ρ of 1.0 means the model ranks every variant in exactly the wet-lab order; ρ of 0 means the model’s ranking is uncorrelated with the experimental ranking; negative ρ means the model ranks variants in the wrong order. In clinical biomarker correlation literature, ρ in the 0.5–0.7 range is generally considered strong; below 0.3 is generally considered weak. We use that same convention here.
The public ground-truth infrastructure for benchmarking protein language models is ProteinGymA standardized benchmark suite for protein variant effect predictors, covering 217 deep mutational scanning assays across diverse protein families.Full definition, a curated benchmark of 217 DMS assays with reported model scores across many protein language models, and MaveDBThe public repository for deep mutational scanning and multiplexed variant effect datasets. Each dataset gets a persistent URN for citation and reproducibility.Full definition, the underlying assay database where DMS data lives. Both are continuously updated and version-tracked; throughout this page, when we cite ProteinGym, we cite at a frozen access date so the reader can verify against the exact upstream snapshot we used.
How the verification process works

The verification mechanism behind the green badges has three steps and one structural feature that distinguishes it from a vendor self-check.
Step 1 — authoring. A drafting agent writes a claim with an explicit citation pointer: a DOI, a URL, or a path to a committed data file at a specific version. The pointer is part of the claim, not appended to it.
Step 2 — verification. A separate agent (Veritas) with separate working memory and no access to the drafting agent’s reasoning fetches the primary source and checks the claim along two axes: arithmetically (does the number in the claim match the number in the source?) and semantically (does the framing of the claim match what the source actually says, or has the meaning drifted in transit?). Veritas produces a verification result — verified, contradicted, single-source, or reference fact — and writes it to a version-controlled audit trail before the page goes live.
Step 3 — public audit trail. The result, the primary source it was checked against, and the exact source version are all public. The reader clicks a badge to see the chain. We cannot rewrite a result without leaving a record.
The structural feature that distinguishes this from a vendor self-check is identity separation. The drafting agent and the verifying agent are distinct: separate instructions, separate working memory, separate session state. The verifying agent does not see the drafting agent’s reasoning; it only sees the claim text and the cited source. That separation is what makes the answer to the natural objection — “isn’t AI-verifying-AI circular?” — no, at least under this construction. Circularity is when the same reasoning that generated a claim also validates it. Identity-separated verification grounds the check in the primary source and a distinct working context.
The process is honest about its own failure modes. As mentioned in §1, our own near-miss case (a population/predicate-drift claim that survived initial verification) is part of the audit trail. The result on that claim was overturned on re-verification, and the overturn is recorded. The process is not infallible; it is auditable, and it improves under iteration. That is the trust pivot. Everything else on this page rests on it.
How we picked the six benchmark proteins
Inference-tool vendors get to pick the assays they validate against. That choice determines the headline number. A model curated against carefully-chosen-easy assays makes a different claim than one that picks adversarially and discloses where it fails. Reading any vendor benchmark page, the first question to ask is not “what is the headline number?” but “what did they pick, and what did they leave out?”

Our cohort is 6 proteins, of which 5 contribute the 7 DMS entries that the benchmark median is computed over; the 6th, Calmodulin, is held out of the median as an openly disclosed weakness, detailed in §6 (CLM-METHOD-001Verified · CLM-METHOD-014Verified). Selection criterion: clinical and research relevance, not adversarial difficulty. Each protein represents a real downstream application:
- TPMT — thiopurine pharmacogenetics; loss-of-function drives myelosuppression risk in inflammatory bowel disease and leukemia treatment
- CYP2C9 — drug-metabolism pharmacogenetics; allele variants alter clearance of warfarin and dozens of other small molecules
- INSR — metabolic-receptor signaling; loss-of-function underlies severe insulin resistance syndromes
- BRCA1 — cancer-VUS classification; variant interpretation is the entire question for clinical genetic counseling
- PTEN — cancer-VUS classification; same use-case, different functional grammar
- Calmodulin — protein-protein binding; included as a known-weakness disclosure case, surfaced in detail at §6
The cohort is computed per DMS entry, not per protein (CLM-METHOD-008Verified). Two proteins enter as two entries each: CYP2C9 contributes separate activity and abundance DMS from Amorosi et al. 2021, because activity and abundance measure different aspects of variant impact and collapsing them would silently misweight the cohort. BRCA1 contributes separate RING-domain and BRCT-domain DMS from Findlay et al. 2018, because the two domains have distinct functional grammars and the model performs differently on each.
The numbers
Across the seven DMS entries, NeuroAutomata’s ESM-2 650M inference posts a cohort median Spearman ρ of 0.5298 (CLM-METHOD-002Verified). In clinical biomarker correlation terms, that sits in the “strong” range — the model’s ranking of variants by likely disruption matches the wet-lab ranking at a level where downstream decisions can use the ranking as one input among others.
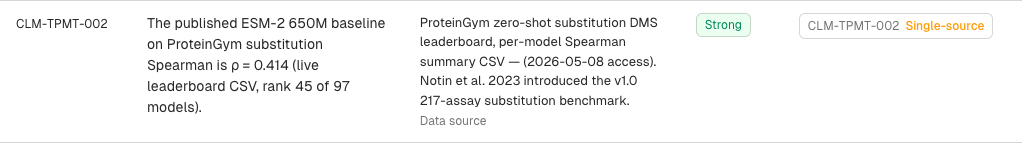
The comparison baseline is ESM-2 650M’s own published per-cell Spearman in the ProteinGym leaderboard cross-DMS average: ρ = 0.414 (CLM-METHOD-004Verified). The source-of-record is pinned to a frozen archive at the exact upstream version; catalog access date 2026-05-08 (CLM-METHOD-009Verified). Against that anchor, the cohort outperforms by +28.0% (CLM-METHOD-005Verified).
A note on which delta you are reading. Cohort-frame surfaces — this page, our Validation Results page, the cohort paragraph of Why We Built NeuroAutomata — cite the delta against the cross-leaderboard cohort average (the +28.0% figure). Per-post verification pages cite the delta against each protein’s own ProteinGym row (a different metric, computed differently). Both fields are correct under their respective surface conventions. Mixing them silently misrepresents the cohort (CLM-METHOD-010Verified).
Per-cohort-entry ρ

| Protein | DMS assay | Spearman ρ |
|---|---|---|
| INSR | insulin binding (MaveDB urn:mavedb:00001239-a-6) | 0.3989 |
| BRCA1 | RING domain (Findlay et al. 2018) | 0.409 |
| PTEN | abundance (Matreyek et al. 2018, VAMP-seq) | 0.484 |
| TPMT | abundance global (Matreyek et al. 2018, VAMP-seq) | 0.5298 |
| BRCA1 | BRCT domain (Findlay et al. 2018) | 0.534 |
| CYP2C9 | abundance (Amorosi et al. 2021) | 0.634 |
| CYP2C9 | activity (Amorosi et al. 2021) | 0.679 |
Sorted ascending; the median sits at TPMT global ρ = 0.5298 (entry 4 of 7) (CLM-METHOD-003Verified). Sorting ascending is intentional — it lets the reader see both ends of the cohort spread at a glance, not just the headline figure. The lowest-performing entry (INSR) and the highest-performing entry (CYP2C9 activity) both belong to the cohort; the median is the middle of a real distribution.
The named weakness
A vendor that buries known weaknesses sells the reader a number they cannot trust on their own protein. A page that surfaces them sells the reader a methodology they can audit on their own protein. The Calmodulin disclosure is what this page’s positioning thesis looks like in concrete form.
How to read a verification report
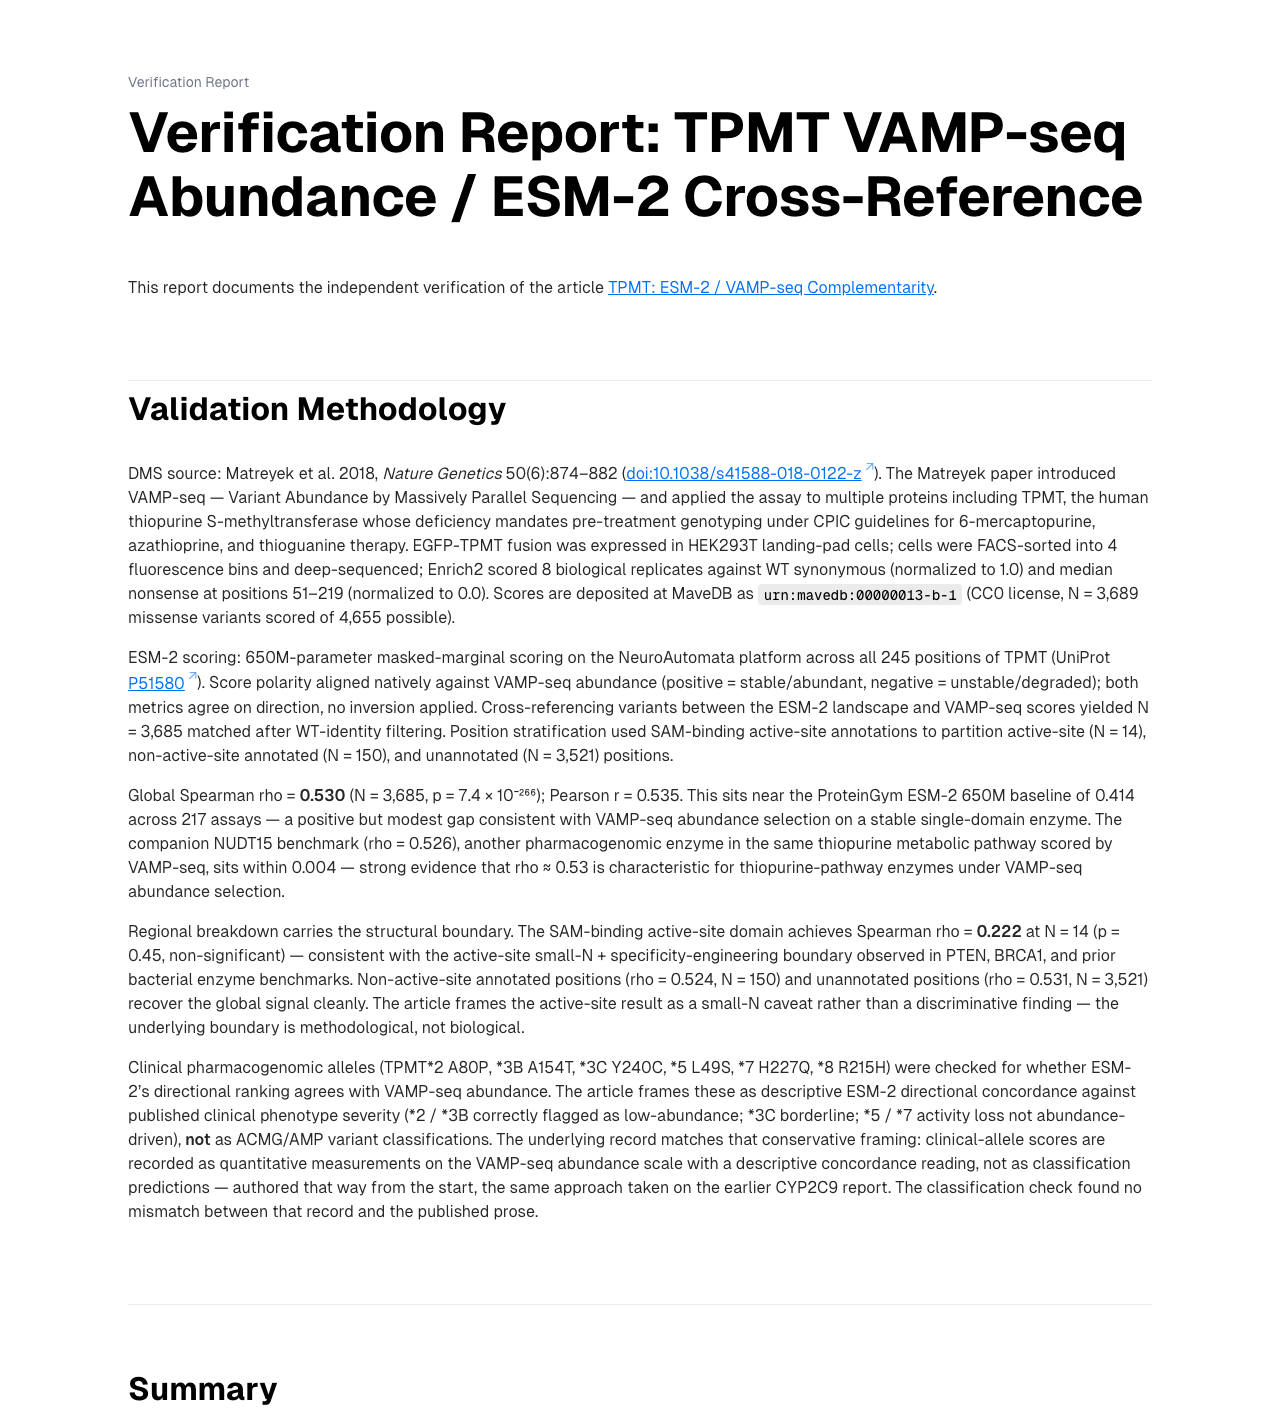
Every green badge on this page is a clickable audit trail to a verification report — a public, version-controlled record of what was checked, against what source, and with what result. This section walks through one such report end-to-end so you can read any of them fluently. Worked example throughout: the TPMT VAMP-seq complementarity verification page — a report that records both a passing result and a disclosed methodological weakness, so you’ll see what each looks like — annotated part by part.
Think of a verification report as a court record. The badge on a blog post is the verdict line at the top of the case file, and clicking it opens the case file itself. Inside, each claim is the indictment: a specific assertion the page is making. Each primary source is the exhibit the result was checked against. The verification result itself — written down in a version-controlled record before the page went live — is the court transcript. The source-version stamp is the date-stamp on the exhibit, recording the exact version of the source the verifier checked. Reading a verification report from top to bottom, you’ll see, first, the result card that summarizes the whole case; next, the per-claim breakdown that lists each indictment with its exhibit and result; and last, the result states beyond “verified” — what they mean and when you’ll see them.
What you see first: the result card
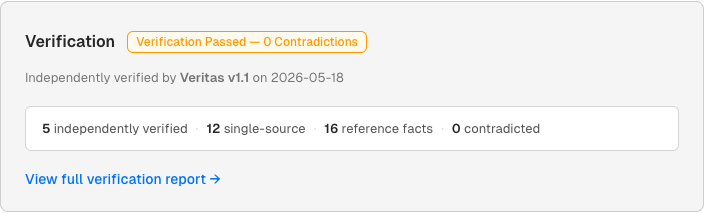
Each blog post on this site ends with a result card. It summarizes the whole case at a glance: how many claims the post made, and how each one came out — independently verified, single-source measurement, reference fact, or contradicted. The headline reports the one thing that gates publication: were any claims contradicted by their sources? On every page here the answer is zero, so the page passed and went live — but “passed” means nothing was contradicted, not that every claim was independently confirmed; the breakdown beneath the headline shows exactly how many were. (This page is the unusual case where every claim — 23 of 23 — is independently verified; the worked example below, the TPMT report, is the more typical mixed result.) If anything had to be overturned after publication, the card records the supersede.
The card is the outcome summary in court-record terms — the bottom line without the transcript. Below the card sits a link — “view full verification report” — that opens the case file. That’s where the rest of this section walks.
- “Verification Passed — 0 Contradictions” headline — the outcome line: the page cleared verification because no claim was contradicted by its source (not a claim that every claim was independently confirmed)
- Veritas attribution and date — who did the verification and when the result was rendered
- Claim breakdown — how the claims came out: independently verified, single-source measurements, reference facts, and contradicted — the honest counts (5 / 12 / 16 / 0 for TPMT), not a single pass percentage
- “View full verification report” CTA — the click-through into the case file itself
What you see when you click through: the per-claim breakdown
- Page title — slug-anchored to the article whose claims this report reviews
- Link to article — the case file’s reference back to the claim source
- “Validation Methodology” section — transparent disclosure of how the verification was performed, preceding the per-claim list
The full verification report lists every claim the post made, in the order the reader encountered them, each with four pieces of evidence next to it:
- The claim text — the exact assertion as the post stated it (the indictment)
- The primary source — the DOI, URL, or committed data path against which the claim was checked (the exhibit)
- The verification result — verified, contradicted, single-source, or reference fact (the transcript entry)
- The source-version stamp — the exact version of the source the verifier checked (the date-stamp on the exhibit)
- Claim ID column — the indictment identifier; each claim carries a stable, citable ID
- Claim text column — what the post is asserting (the indictment language itself)
- Primary source column — the exhibit the indictment is anchored to
- Evidence strength badge — qualitative grading independent of result (the case for the claim, before any result is rendered)
- Status column — the verification-result state for this claim
For the TPMT VAMP-seq complementarity report, the per-claim list runs 33 claims long: 5 verified, 12 single-source measurements, 16 reference facts, 0 uncheckable, 0 contradicted (CLM-METHOD-013Verified). The 5 verified claims carry the load-bearing factual content — the cohort ρ figures, the named-weakness disclosure, the comparison baseline. The 12 single-source-measurement claims are quantitative values — specific DMS scalars and per-cell scores — each backed by exactly one source (an internal measurement or a single external citation) with no independent second source to corroborate against; they publish, flagged as single-source so the reader sees the cardinality. The 16 reference-fact claims are the qualitative material — clinical framing, applicability notes, methodological and comparative statements — that doesn’t have a single arithmetic value to check; they publish, flagged as reference facts.
Identity separation between author and verifier is what makes this list non-circular (CLM-METHOD-012Verified). The verifier never sees the author’s reasoning — only the claim text and the cited source. The list is the verifier’s record, not the author’s.
Beyond verified: single-source, reference-fact, FAIL→fix, and the reserved contradicted state
Not every claim ends up “verified.” Four other result states exist, and the TPMT report itself shows the two most common.
Single-source measurement. A quantitative value backed by exactly one source — whether an internal measurement (one DMS scalar, one per-cell score) or a single external citation — with no independent second source to corroborate it against, by construction. The “single” is about how many sources back the value (one), not about internal-versus-external: a value resting on one cited paper is still single-source. It’s not unverified and it’s not unreliable: it’s measured once. It’s distinct from a verified claim (which round-trips against its source) and it is not a coverage gap. The TPMT report has 12 of these; they publish, carrying a “single-source” flag the reader can see, so the reader knows the value rests on one source.
Reference fact (not checked at this layer). A qualitative claim — a clinical framing note, an applicability statement, a methodological or comparative remark — that doesn’t assert a single arithmetic value to check against a primary source. The TPMT report has 16 of these. They publish, flagged as reference facts. Honest disclosure: the page is making the statement, but it isn’t the kind that has a single primary-source number to arithmetic-check.
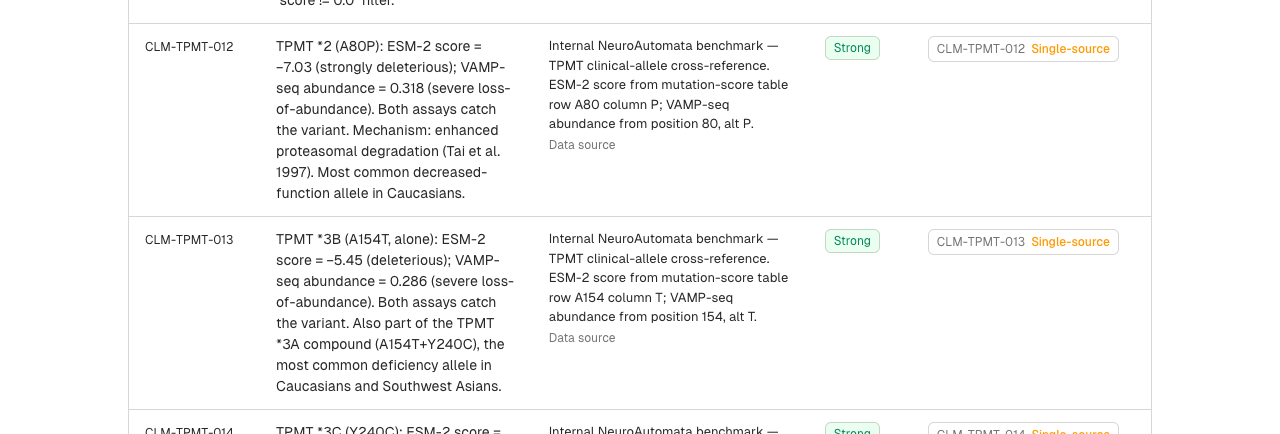
- First non-verified row — a single-source-measurement result (a quantitative DMS scalar, one source)
- Second non-verified row — a reference-fact result (qualitative context, no single number to check) — different state, demonstrating the result types are a separable taxonomy, not one bucket
- “Strong” evidence-strength badge — independent dimension: a claim can carry strong evidence and receive a non-verified result (different axes, both transparently disclosed)
FAIL → fix. Sometimes a verifier finds a misframing the author missed. When this page was being drafted, a claim about AI-related retractions used the framing “accelerating year-over-year.” The verifier fetched the underlying Frontiers paper and found that 2023 had been the surge year and 2024 declined back below it — the framing was source-incorrect. The result came back FAIL. The author reshaped the claim’s text to match what the source actually says (“retractions surged in 2023 and remained elevated into 2024”), and the verifier re-checked against the now-aligned claim. Re-verify came back PASS. Both transcript entries — FAIL and re-PASS — live in the audit trail. The page demonstrates the discipline in the act of describing it.
The pedagogical point isn’t that errors happen. It’s that reshaping the claim text to match the source preserves the claim-canonical-form contract. The claim still says one thing; the result still applies to that one thing; the source-version stamp still points at one fetched payload. The fix doesn’t paper over the misframing — it makes the claim and the source agree before the page goes live (CLM-METHOD-TRUST-001Verified).
Contradicted (reserved). A “contradicted” result is what you’d see if a claim arithmetically or semantically disagreed with its cited source — the kind of FAIL that survives because the underlying source genuinely refutes the claim being made. As of this writing, no live page on this site carries a contradicted result; the state exists in the process and is reserved for when it’s earned. We surface this honestly rather than synthesize an example — the absence of a contradicted-state worked example is itself a signal about the source-discipline the page is built on.
What makes it reproducible
A result you cannot trace isn’t much better than a result you’re asked to trust. Every verification report records its result at a pinned source version — shown in the note at the bottom of each report: the verification result on record, plus the exact version of each source it was checked against, as a cross-checked trail. A reader a year from now can follow that version stamp back to the precise data and verification state the result was rendered against. That version-stamped record is what makes “verified” reproducible rather than asserted — the same traceability the institutional trust architecture (§1) provided slowly, here built into the page.
What this page does not claim
This page is a cohort-frame surface. It cites cohort-aggregate figures and the named-weakness disclosure at cohort-frame grain. It does not cite per-protein delta figures, per-allele clinical reasoning, or which specific variants ESM-2 catches that wet-lab assays miss. That per-protein context lives in the per-post verification pages cross-linked below (CLM-METHOD-015Verified).
A reader interested in methodology of the methodology is in the right place. A reader interested in clinical-class context for a specific protein should consult the per-post verification page for that protein.
Per-post verification pages
The published verification pages cite per-protein figures and clinical context at the surface appropriate to each protein:
- TPMT pharmacogenetics — ESM-2 × VAMP-seq complementarity — 5 canonical thiopurine alleles, the activity-without-abundance subset (*5, *7), and the Calmodulin named-weakness disclosure at per-post grain
- CYP2C9 pharmacogenetics — ESM-2 × Amorosi 2021 — 6,142 variants, activity vs abundance separation, the heme-binding result
- BRCA1 + PTEN cancer-VUS classification — 5,949 variants, BRCT non-active-site ρ = 0.772, and the catalytic-dead-but-stable problem
- INSR insulin-receptor joint-coverage — 14,000+ variants on the ectodomain DMS
Each per-post page follows the same methodology shown here: cohort-frame context for orientation, per-protein figures for clinical reasoning, every quantitative claim independently verified before publication.
Validation methodology by Compose, source authored by NeuroAutomata, independently verified by Veritas, directed by Jonathan Agoot — Axon Agentic. All verification data and audit trails available on request.