Why ESM-2 catches the TPMT alleles VAMP-seq misses
On this page
The TPMT dosing problem isn’t fully solved
A clinical pharmacology lab running thiopurine pharmacogenetic testing has, since 2013, had genotype-guided dosing recommendations for the canonical TPMT decreased-function alleles — *2, *3A, *3B, *3C — through the Clinical Pharmacogenetics Implementation Consortium ([1]CPIC Guideline for Thiopurine Dosing Based on TPMT and NUDT15 Genotypes: 2025 Updatedoi:10.1002/cpt.70209). Those four alleles account for the vast majority of decreased-function alleles in studied populations.
The remainder is the problem. TPMT *5 (L49S) and TPMT *7 (H227Q) reduce thiopurine S-methyltransferase activity without reducing protein abundance. They’re rare, but they matter — a patient carrying *5 retains near-wild-type abundance of TPMT in their red blood cells, so an abundance-based clinical assay will miss them entirely. The variant is reported in the literature as very low activity ([2]Nomenclature for alleles of the thiopurine methyltransferase genedoi:10.1097/FPC.0b013e32835f1cc0) — but the structural mechanism that makes *5 invisible to abundance also makes it harder to characterize at scale.
This is where the post starts. We have VAMP-seqA high-throughput assay that measures protein abundance (expression and stability) for thousands of variants simultaneously using fluorescent protein fusions and flow cytometry.Full definition data for 3,685 TPMT variants — the canonical Matreyek 2018 dataset that anchored the original VAMP-seq paper ([3]Multiplex Assessment of Protein Variant Abundance by Massively Parallel Sequencingdoi:10.1038/s41588-018-0122-z). We cross-referenced ESM-2 650MA protein language model by Meta AI trained on 250 million protein sequences. Predicts how amino acid mutations affect protein function from sequence alone — no structure required.Full definition evolutionary-scale predictions against every one of them. The question worth asking: where does the sequence-only model agree with the abundance assay, and where does it disagree — specifically, which clinical alleles end up in the disagreement set?
The answer matters for clinical practice. If ESM-2 and VAMP-seq agreed everywhere, ESM-2 would be a faster way to reach the same conclusion. If they disagree systematically on the activity-loss subset that VAMP-seq is structurally blind to, the two assays are complementary, not redundant. The data says complementary.
How we ran the cross-reference
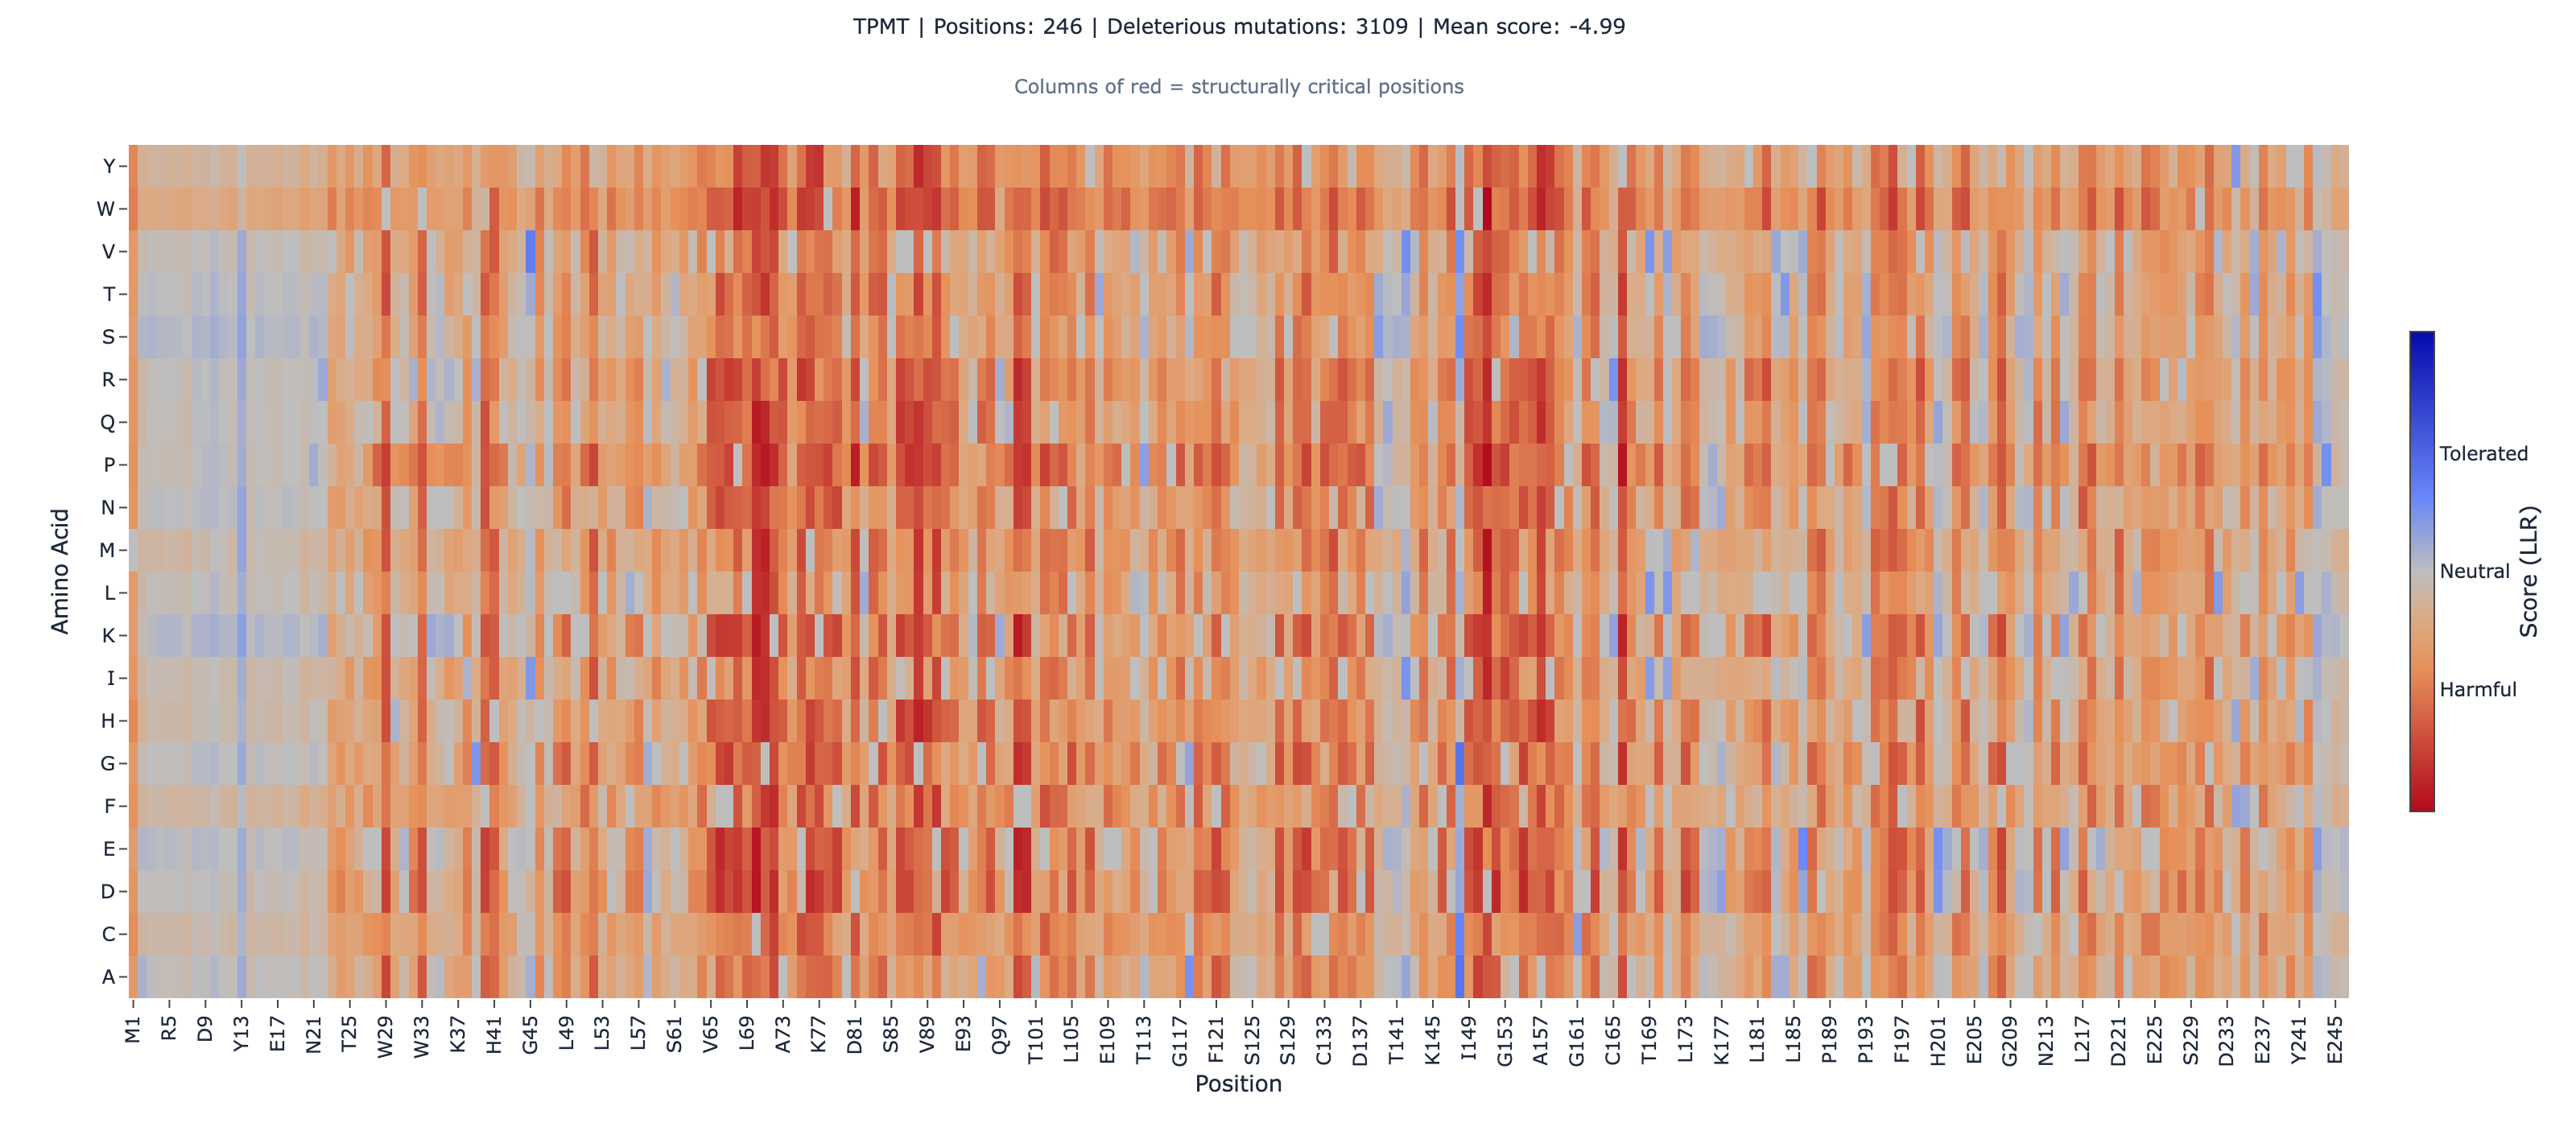
We scored all 245 positions in TPMT (UniProt P51580) across all 20 amino acid substitutions using ESM-2’s masked marginal scoringESM-2's zero-shot method for scoring variant effects. It masks each position and measures how surprising the mutant amino acid is relative to wild-type.Full definition, then computed Spearman rank correlationA rank correlation coefficient (−1 to +1) that measures whether two variables agree in order, not magnitude. The primary metric for variant effect benchmarks.Full definition against the VAMP-seq abundance scores from the Matreyek 2018 dataset (GEO accession GSE108727).
How We Tested This
- Model
- ESM-2 650M (facebook/esm2_t33_650M_UR50D)
- Dataset
- Matreyek 2018 TPMT VAMP-seq (3,685 missense variants after filtering WT-identity substitutions)
- Metric
- Spearman rho
- Version
- v0.17.0
ESM-2 650M was selected as the model size with peak performance on the ProteinGym substitution Spearman benchmark — 0.414 across 217 DMS assays, rank 45 of 97 models (CLM-TPMT-002Single-source). The 3B and 15B ESM-2 variants both score below 650M on this benchmark (3B = 0.406, 15B = 0.400) (CLM-TPMT-003Reference fact), so larger does not mean better here. Inference run via masked-marginal scoring on the full 245-amino-acid sequence; per-variant log-likelihoods compared against Matreyek 2018 abundance scores. The 4-variant filter score != 0.0 excludes WT-identity substitutions (Q47S, L243L, T244T, E245E) where the abundance score carries no informational signal.
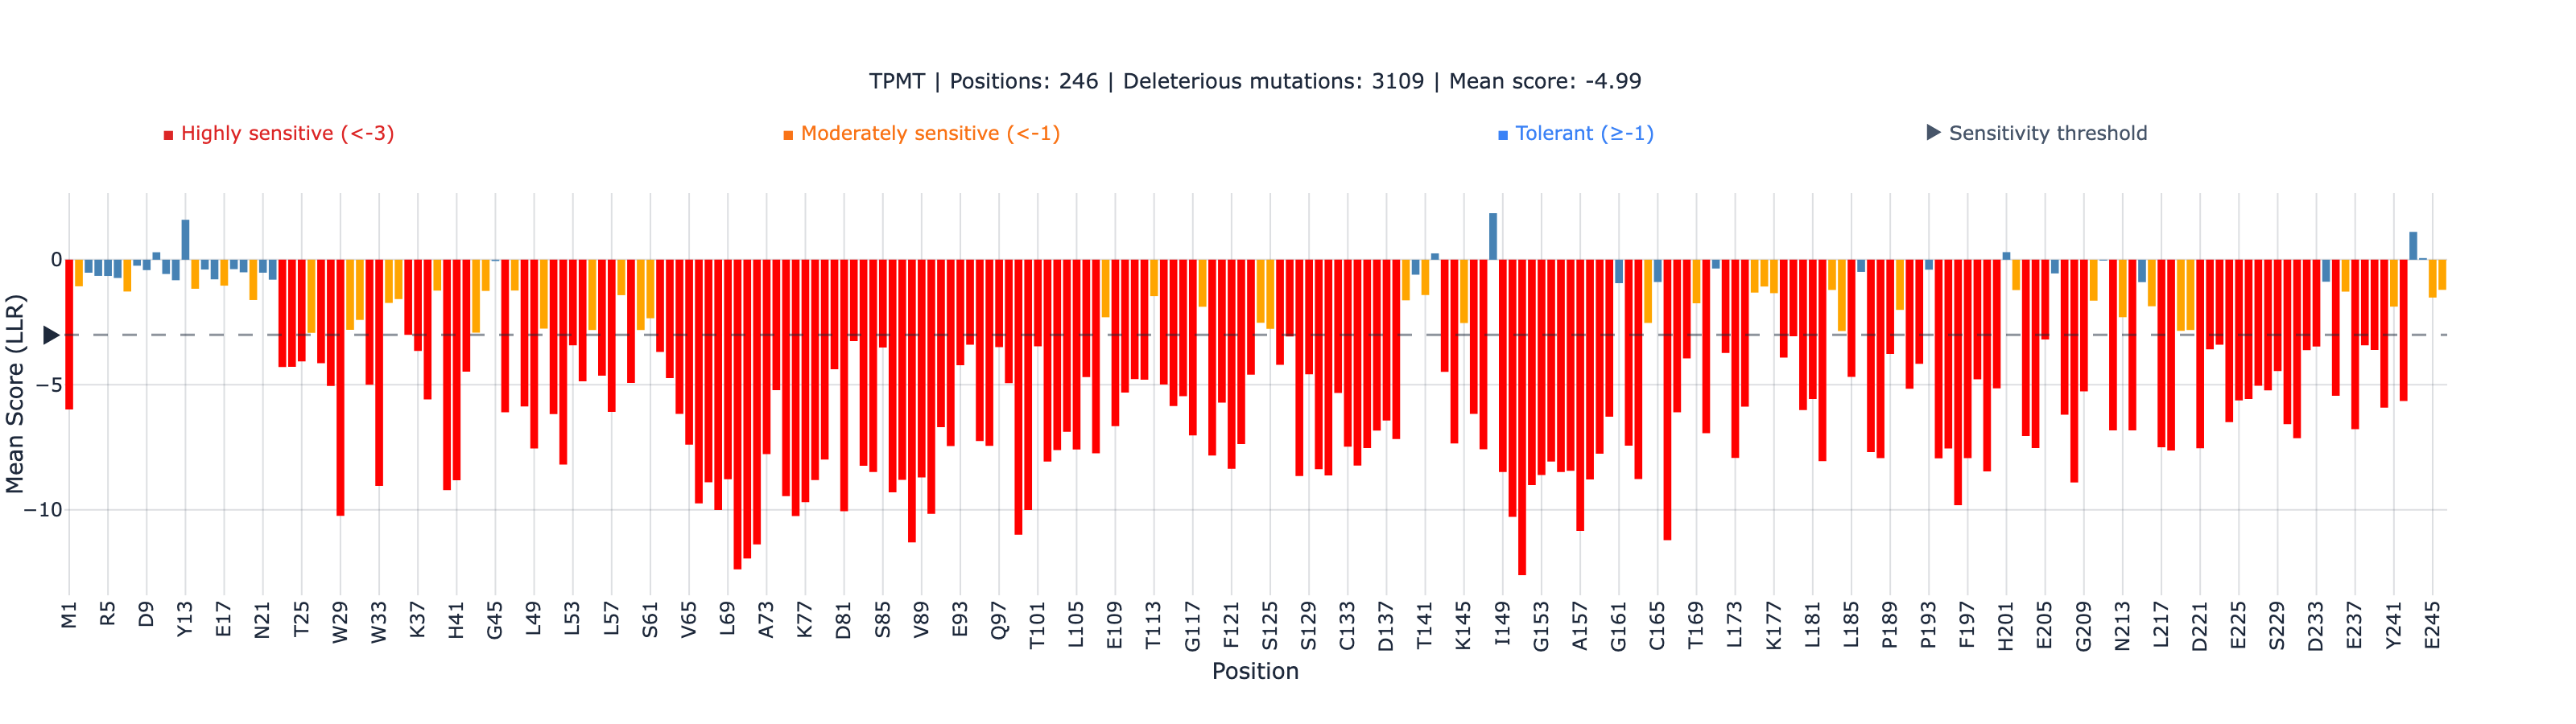
Global correlation: ESM-2 ranks TPMT variants at rho = 0.5298
Across 3,685 variants, ESM-2 ranking agrees with VAMP-seq abundance ranking at Spearman ρ = 0.5298 (p = 7.4 × 10⁻²⁶⁶, Pearson r = 0.5353) (CLM-TPMT-010Verified). That’s about 28% above the published ESM-2 650M ProteinGym aggregate baseline of 0.414 (CLM-TPMT-019Reference fact), and it sits roughly at the median of our internal 5-assay benchmark (median 0.515, computed against unrounded 0.5147; delta vs baseline = 24.3%) (CLM-TPMT-041Verified).
But the global ρ is the boring number. The interesting question is per-allele: where does ESM-2 catch what VAMP-seq misses, and where does the inverse hold?
The five clinical alleles
The pharmacogenetically actionable TPMT alleles per the CPIC framework are *2, *3A, *3B, *3C, *5, and *7. (*3A is the compound A154T + Y240C, so it’s captured by checking *3B and *3C separately; we don’t score it as a distinct variant.) Here’s what each assay says:
| Allele | Variant | ESM-2 score | VAMP-seq abundance | ESM-2 catches | VAMP-seq catches |
|---|---|---|---|---|---|
| TPMT *2 | A80P | −7.03 | 0.318 | ✓ | ✓ |
| TPMT *3B | A154T | −5.45 | 0.286 | ✓ | ✓ |
| TPMT *3C | Y240C | −4.26 | 0.600 | ✓ | ✓ |
| TPMT *5 | L49S | −7.68 | 0.790 (WT-like) | ✓ | ✗ |
| TPMT *7 | H227Q | −3.27 | 0.770 (WT-like) | ✓ | ✗ |
The TPMT *2 / *3B / *3C set is the proteolytic-degradation subset — variants that destabilize the protein, get cleared by the proteasome, and drop intracellular abundance well below wild-type ([4]Enhanced proteolysis of thiopurine S-methyltransferase (TPMT) encoded by mutant alleles in humans (TPMT*3A, TPMT*2)doi:10.1073/pnas.94.12.6444). VAMP-seq catches them because their mechanism is exactly what the assay measures. ESM-2 also catches them because the mutated residues sit at evolutionarily conserved positions and the substitutions are evolutionarily implausible. Both methods independently flag the same set as deleterious.
The TPMT *5 / *7 set is different. Both variants retain near-wild-type abundance — 0.790 for *5, 0.770 for *7 (where 1.0 is wild-type). VAMP-seq’s signal is structurally inconclusive here. ESM-2 catches them anyway. The TPMT ESM-2 score distribution across all 3,685 variants has mean −5.02 and standard deviation 3.82. Against that distribution, the *5 (L49S) score of −7.68 sits about 0.7σ below mean — more deleterious than the average TPMT variant by a clear margin (CLM-TPMT-015Single-source). The *7 (H227Q) score of −3.27 sits about 0.5σ above mean — less deleterious than the average variant but still clearly negative, still flagged as deleterious in absolute terms (CLM-TPMT-016Single-source).
That’s the complementarity. The two assays measure different things — VAMP-seq measures stability via abundance; ESM-2 measures evolutionary plausibility via sequence context. They agree on the variants where stability is the rate-limiting step for function. They disagree on the variants where activity drops without stability dropping — and the disagreement is the signal that those variants exist and matter clinically.
Across all five canonical clinical alleles, ESM-2 ranks every one of them deleterious from sequence alone (CLM-TPMT-017Reference fact). VAMP-seq catches the proteolytic-degradation subset. The two together cover the full clinical-allele set with overlap on three and complementarity on two.
A note on categorical agreement
If you compute the per-variant categorical agreement between ESM-2 and VAMP-seq across all 3,685 TPMT variants, you get 13.2% (488 agree, 3,197 disagree, excluding neutral) (CLM-TPMT-020Single-source).
That number looks small. It isn’t a failure. A naïve reader would conclude that ESM-2 and VAMP-seq disagree on 87% of variants, so one of them must be wrong. The substantive interpretation is the opposite: ρ = 0.5298 + categorical agreement = 13.2% says the two assays agree on the ranking of variants by deleteriousness while disagreeing on the per-variant categorical class. They measure different things, agree on direction, disagree on cutoff. That’s what makes them complementary rather than redundant. If they categorically agreed at 95%, you’d run one assay; you wouldn’t need both.
The active-site stratum
When we stratify the 3,685 TPMT variants by position type — active-site, non-active-site annotated, and unannotated positions — the picture splits (CLM-TPMT-018Verified):
| Stratum | N | Spearman ρ | p-value | Significant? |
|---|---|---|---|---|
| Active-site | 14 | 0.222 | 0.45 | No |
| Non-active-site annotated | 150 | 0.5244 | 5.7 × 10⁻¹² | Yes |
| Unannotated positions | 3,521 | 0.5313 | 8.1 × 10⁻²⁵⁶ | Yes |
The active-site stratum’s small sample size (n = 14) and p-value of 0.45 mean we can’t claim ESM-2 also works at the active site from this stratum. We can claim it works at the non-active-site stratum at ρ ≈ 0.52, with statistical robustness. All five canonical clinical alleles sit in the non-active-site annotated stratum per their position_type in the Matreyek 2018 dataset, which is where ESM-2 is reliable.
This is the kind of stratified honesty the post is built on. ESM-2 isn’t a universal classifier; it’s a ranking tool with characterized strengths and weaknesses. Where it works (non-active-site, single-protein stability, evolutionary-conservation-driven function), it works well. Where the data is thin (n = 14 at the TPMT active site), we don’t overclaim.
PTEN: the same complementarity at a different protein
We ran the same cross-reference on PTEN, against Matreyek 2018’s PTEN VAMP-seq dataset (4,112 variants). The pattern repeats with a sharper signal at the active site.
| Stratum | N | Spearman ρ | Significant? |
|---|---|---|---|
| Global | 4,112 | 0.4836 | Yes |
| Non-active-site annotated | 205 | 0.5357 | Yes |
| Active-site (CX5R catalytic motif) | 84 | −0.0113 | No |
The PTEN active-site stratum is the interesting case (CLM-TPMT-030Verified). At the catalytic CX5R motif (residues C124–R130), ESM-2 and VAMP-seq abundance show zero rank correlation — ρ = −0.011, p = 0.92. That’s not a failure of either method. It’s the same complementarity story at a deeper level: the catalytic-active-site variants in PTEN are exactly the “loss of activity only” class that Matreyek’s 2021 follow-up characterized in detail ([5]Integrating thousands of PTEN variant activity and abundance measurements reveals variant subgroups and new dominant negatives in cancersdoi:10.1186/s13073-021-00984-x) — about 6% of classified variants are catalytically dead but structurally stable. C124S retains abundance 1.14 despite being phosphatase-dead; R130G retains 1.09 at the most-frequently-mutated PTEN residue in cancer; G129E retains 0.76 (CLM-TPMT-032Single-source).
The PTEN catalytic-dead-but-stable class is what makes the ESM-2 active-site ρ go to zero. It also makes the Matreyek 2021 dominant-negative discovery measurable: Akt1 T308 phosphorylation correlates with tumor incidence at Pearson r = 0.76 across the dominant-negative variant set (CLM-TPMT-033Single-source). For the full PTEN story including the BRCA1 cross-reference, Part 3 of this series covers PTEN at depth.
Where this fails
The TPMT and PTEN complementarity story makes ESM-2 useful where it’s useful. The post would be incomplete without naming where it isn’t. A note on scope before the load-bearing failure modes: ESM-2’s performance degrades in intrinsically disordered regions because evolutionary conservation patterns differ from structured domains — for PTEN, the C-terminal regulatory tail (residues 351–403) is the relevant case, and ESM-2 scores in disordered regions should not be used without orthogonal validation. The three callouts below are the load-bearing limitations.
What’s next for the benchmark
TPMT’s abundance-driven decreased-function mechanism — proteolytic degradation of the *2, *3B, *3C variants, evolutionary conservation at the residue level — generalizes to receptor-class and ion-channel-class proteins where stability is the rate-limiting step for function. The Matreyek lab has published or contributed to deep mutational scanning datasets on INSR (insulin receptor, ~14,000 variants, Nature Communications 2025), LDLR (low-density lipoprotein receptor, Science 2026), KCNE1 (arrhythmia ion channel, 2,554 variants, Genome Medicine 2024), and STIM1 (calcium-sensing EF-hand, 706 variants, Genetics 2025) (CLM-TPMT-050Reference fact). Each is an obvious adjacency for the same ESM-2 cross-reference approach — different clinical phenotypes, similar abundance-vs-activity orthogonality questions.
How we verified this
This analysis was conducted by an AI research agent and independently audited against primary sources by a separate verification agent. The audit trail:
| Category | Result |
|---|---|
| TPMT variant ESM-2 scores checked | 5 canonical clinical alleles (per-allele csv lookup) |
| TPMT variant VAMP-seq abundance scores checked | 5 canonical clinical alleles |
| TPMT global correlation verified against the cross-reference dataset | ρ = 0.5298, N = 3,685, p = 7.4 × 10⁻²⁶⁶ — match |
| TPMT position stratification verified | active 0.222 (n=14, ns) / non-active 0.5244 (n=150) / unknown 0.5313 (n=3,521) |
| Geometric framing of *5/*7 σ-distances | Directionally correct (*5 ≈ 0.7σ below mean, *7 ≈ 0.5σ above; against the dataset mean −5.02, std 3.82) |
| ProteinGym baseline verified | 0.414, rank 45 of 97, live leaderboard CSV access 2026-05-08, re-verified 2026-05-12 |
| 5-assay benchmark median verified | 0.515 (computed against unrounded 0.5147) |
| Calmodulin disclosure verified | ρ = 0.2116 internal; cohort-frame delta −48.9% vs cross-leaderboard 0.414 (load-bearing weakness); per-protein delta −0.19% vs 0.212 (parity post Phase A correction at the pinned validation summary, version a45a8ca) |
Every quantitative claim in this post traces to either a primary published source or a committed deterministic data file in our benchmark repository. If you find a discrepancy, contact us — we’ll correct and credit.
Reproduce this
You can independently verify every result in this post.
Step 1: Get the experimental data
# TPMT VAMP-seq abundance data from Matreyek 2018
# GEO accession: GSE108727

# Matreyek 2018 paper: 10.1038/s41588-018-0122-z
# Open access at PMC5980760
Step 2: Run ESM-2 scoring
Score the full 245-amino-acid TPMT sequence (UniProt P51580) using ESM-2 650M (facebook/esm2_t33_650M_UR50D) with masked-marginal scoring. Takes about 30 seconds on the NeuroAutomata platform. Request early access to run this yourself.
Step 3: Compute correlation
Calculate Spearman rank correlation between ESM-2 scores and VAMP-seq abundance scores for all matched missense variants. After filtering WT-identity substitutions (score != 0.0), you should get ρ ≈ 0.530 (±0.005).
Data sources:
| Resource | Link |
|---|---|
| TPMT VAMP-seq paper | Matreyek et al. 2018, Nature Genetics (PMC5980760) |
| TPMT data deposit | GEO GSE108727 |
| PTEN abundance + activity integration | Matreyek et al. 2021, Genome Medicine (PMC8518224) |
| ESM-2 model paper | Lin et al. 2023, Science |
| ESM-2 model weights | facebook/esm2_t33_650M_UR50D |
| ProteinGym leaderboard CSV | OATML-Markslab/ProteinGym |
| CPIC thiopurine guideline | Maillard et al. 2026, Clinical Pharmacology & Therapeutics |
| UniProt (TPMT) | P51580 |
Try it on your protein
This analysis was run on NeuroAutomata, a browser-based ESM-2A protein language model by Meta AI trained on 250 million protein sequences. Predicts how amino acid mutations affect protein function from sequence alone — no structure required.Full definition scoring platform. NeuroAutomata is currently in early access for protein engineers, clinical researchers, and methods developers. Request an invite to score your own sequences — up to 1,024 amino acids, full mutation landscape in ~30 seconds, no installation required.
TPMT is one of several pharmacogenomic enzymes we’ve systematically benchmarked. Adjacent posts cover CYP2C9 pharmacogenomics and BRCA1+PTEN cancer-VUS classification with the same audit methodology shown above.
Research Use OnlyResearch Use Only — a regulatory designation meaning the tool provides research scores, not clinical diagnoses. The same label used by REVEL, CADD, AlphaMissense, and PolyPhen-2.Full definition. Same designation as REVEL, CADD, AlphaMissense, and PolyPhen-2. ESM-2 scores provide computational evidence to support variant classification workflows, not standalone diagnostic calls. Clinical laboratories validate and incorporate computational scores under their own LDT (laboratory-developed test) workflows.
TL;DR
ESM-2 650M scores 3,685 TPMT variants in under 30 seconds. Against Matreyek 2018 VAMP-seq abundance: ρ = 0.5298 globally (28% above the published ProteinGym baseline of 0.414), with all five canonical clinical alleles (*2, *3B, *3C, *5, *7) ranked deleterious. VAMP-seq catches the proteolytic-degradation subset (*2, *3B, *3C); ESM-2 covers the activity-without-abundance subset (*5, *7) that VAMP-seq abundance is structurally blind to. Orthogonal, not redundant. The disagreement on the activity-loss subset is the signal that the two assays measure complementary aspects of variant impact. Research Use Only.
What’s next
This is Part 4 of the ESM-2 Benchmark Series. Previous posts:
- Part 1: Why We Built NeuroAutomata — ESM-2 accessibility, GB1 engine confirmation, and the 5-assay ProteinGym validation benchmark (Calmodulin disclosed as the known weakness)
- Part 2: CYP2C9 Pharmacogenomics — 6,142 variants, ρ = 0.679, and the heme-binding result
- Part 3: BRCA1 + PTEN Cancer VUS — 5,949 variants, BRCT non-active-site ρ = 0.772, and the catalytic-dead-but-stable problem
Each post follows the same methodology: cross-reference against published experimental data, independently audit every claim, disclose limitations, and provide everything you need to reproduce the results.
Analysis by Compose, independently audited by Veritas, directed by Jonathan Agoot — Axon Agentic. All verification data available on request.
TPMT VAMP-seq data from Matreyek et al. 2018, used with attribution. ESM-2 model by Meta AI (Lin et al. 2023). ProteinGym benchmark data per Notin et al. 2023.
Named-weakness disclosure (Calmodulin). The Calmodulin binding-affinity result (CLM-TPMT-040Verified) is pinned to the validation summary, version a45a8ca. Result ρ = 0.2116 (n = 1,813). Measured two ways: −0.19% versus the per-protein ProteinGym baseline of 0.212 (CALM1_HUMAN_Weile_2017 — essentially parity), and −48.9% versus the cross-leaderboard cohort average of 0.414. We disclose this as a bounded, honest limitation — not folded into the aggregate, not framed as a coverage failure. After the 2026-05-20 correction, the named weakness is load-bearing only at the cohort-average level (−48.9%); at the per-protein level it reads as parity. The weakness is in ESM-2’s binding-affinity prediction at the ProteinGym-cohort level, not a gap specific to our platform. Verification result in the footer below.